
Intermediate Microeconomics and Its Application 12th Edition by Walter Nicholson,Christopher Snyder
Edition 12ISBN: 978-1133189022Intermediate Microeconomics and Its Application 12th Edition by Walter Nicholson,Christopher Snyder
Edition 12ISBN: 978-1133189022 Exercise 24
Why are there two supply curves in Figure (a)? How does this illustrate "feedback" effects? Why would a partial equilibrium analysis of the effect of an increase in demand for tomatoes from D to D' give the wrong answer? 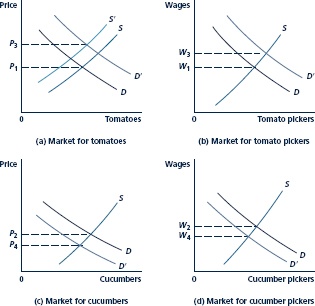
Initially, the market for tomatoes is in equilibrium (at P1), as are the markets for tomato pickers, cucumbers, and cucumber pickers. An increase in demand for tomatoes disturbs these equilibria. Virtually all the supply and demand curves shift in the process of establishing a new general equilibrium.
Initially, the market for tomatoes is in equilibrium (at P1), as are the markets for tomato pickers, cucumbers, and cucumber pickers. An increase in demand for tomatoes disturbs these equilibria. Virtually all the supply and demand curves shift in the process of establishing a new general equilibrium.
Explanation Verified
General equilibrium and partial equilibr...
Intermediate Microeconomics and Its Application 12th Edition by Walter Nicholson,Christopher Snyder
Why don’t you like this exercise?
Other Minimum 8 character and maximum 255 character
Character 255


