
Intermediate Microeconomics and Its Application 12th Edition by Walter Nicholson,Christopher Snyder
Edition 12ISBN: 978-1133189022Intermediate Microeconomics and Its Application 12th Edition by Walter Nicholson,Christopher Snyder
Edition 12ISBN: 978-1133189022 Exercise 7
Why is the intersection between firms' best-response functions in Figure for the Cournot model or 12.3 for the Bertrand model with differentiated products a graphical illustration of the Nash equilibrium concept? 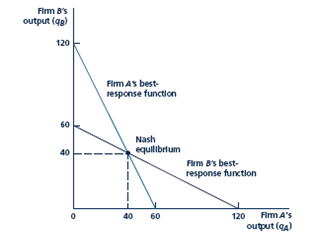
Firm A's best-response function shows the profit-maximizing quantity it would choose for any quantity chosen by firm B. Firm B's best-response function shows the profitmaximizing quantity it would choose for any quantity chosen by firm A. Both firms must play best responses in the Nash equilibrium. The only point on both best-response functions is the point of intersection (qA ¼ 40, qB ¼ 40).
Firm A's best-response function shows the profit-maximizing quantity it would choose for any quantity chosen by firm B. Firm B's best-response function shows the profitmaximizing quantity it would choose for any quantity chosen by firm A. Both firms must play best responses in the Nash equilibrium. The only point on both best-response functions is the point of intersection (qA ¼ 40, qB ¼ 40).
Explanation Verified
The intersection between the firm's best...
Intermediate Microeconomics and Its Application 12th Edition by Walter Nicholson,Christopher Snyder
Why don’t you like this exercise?
Other Minimum 8 character and maximum 255 character
Character 255


