
Intermediate Microeconomics and Its Application 12th Edition by Walter Nicholson,Christopher Snyder
Edition 12ISBN: 978-1133189022Intermediate Microeconomics and Its Application 12th Edition by Walter Nicholson,Christopher Snyder
Edition 12ISBN: 978-1133189022 Exercise 13
Refer to Figure. Suppose demand is
Q = 10,000 - 1,000 P
and marginal cost is constant at MC = 6. From the given demand curve, one can compute the following marginal revenue curve:
a. Graph the demand, marginal cost, and marginal revenue curves.
b. Calculate the price and quantity associated with point C, the perfectly competitive outcome. Compute industry profit, consumer surplus, and social welfare.
c. Calculate the price and quantity associated with point M, the monopoly/perfect cartel outcome. Compute industry profit, consumer surplus, so-cial welfare, and deadweight loss.
d. Calculate the price and quantity associated with point A, a hypothetical imperfectly competitive outcome, assuming that it lies at a price halfway between C and M. Compute industry profit, consumer surplus, social welfare, and deadweight loss.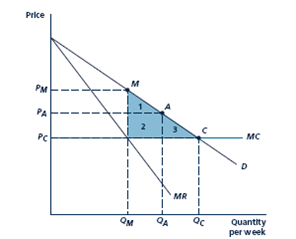
Market equilibrium under imperfect competition can occur at many points on the demand curve. In this figure, which assumes that marginal costs are constant over all output ranges, the equilibrium of the Bertrand game occurs at point C, also corresponding to the perfectly competitive outcome. The perfect-cartel outcome occurs at point M, also corresponding to the monopoly outcome. Many solutions may occur between pointsM and C, depending on the specific assumptions made about how firms compete. For example, the equilibrium of the Cournot game might occur at a point such as A. The deadweight loss given by the shaded triangle is increasing as one moves from point C to M.
Explanation Verified
The demand curve is given as ![]() . The corr...
. The corr...
Intermediate Microeconomics and Its Application 12th Edition by Walter Nicholson,Christopher Snyder
Why don’t you like this exercise?
Other Minimum 8 character and maximum 255 character
Character 255


