
Intermediate Microeconomics and Its Application 12th Edition by Walter Nicholson,Christopher Snyder
Edition 12ISBN: 978-1133189022Intermediate Microeconomics and Its Application 12th Edition by Walter Nicholson,Christopher Snyder
Edition 12ISBN: 978-1133189022 Exercise 19
In Figure, how would an increase in B's marginal cost shift its best-response function? Would it shift A's? On a graph, indicate where the new Nash equilibrium might be.
2. On a graph, show how the best-response functions would shift and where the new Nash equilibrium would be if both firms marginal costs increased by the same amount. What about a cost decrease? What about an increase in the demand intercept above 1/2? What about a decrease in substitutability between the two goods?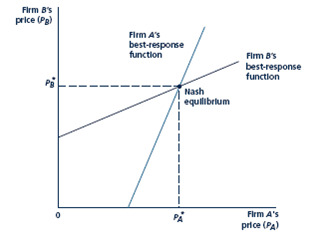
Given demand curves for differentiated products such as Equation and Equation and given assumptions about costs, one can derive best-response functions such as pictured here. A firm's best-response function gives the profit-maximizing price for a firm given a price charged by its competitor. Best-response functions are upward sloping because A, for example, wo uld respond to an increase in B's price, which would raise A's demand, by increasing price. The Nash equilibrium is the point of intersection between the two best-response functions, where A sets a price of P*A and B sets a price of P*B. 424 PART SIX Market Power Copyright 2010 Cengage Learning. All Rights Reserved. May not be copied, scanned, or duplicated, in whole or in part.
Explanation Verified
1) In the figure given below price of fi...
Intermediate Microeconomics and Its Application 12th Edition by Walter Nicholson,Christopher Snyder
Why don’t you like this exercise?
Other Minimum 8 character and maximum 255 character
Character 255


