
Intermediate Microeconomics and Its Application 12th Edition by Walter Nicholson,Christopher Snyder
Edition 12ISBN: 978-1133189022Intermediate Microeconomics and Its Application 12th Edition by Walter Nicholson,Christopher Snyder
Edition 12ISBN: 978-1133189022 Exercise 27
Consider the model of Bertrand competition with differentiated products from the text. Let the demand curves for firms A and B be given by Equation, and let the firms' marginal costs be constant, given by cA and cB. It can be shown that the best-response function for firm A is 
and for firm B is
a. Graph the two best-response functions. Find the Nash equilibrium assuming cA = cB = 0 algebraically and indicate it on the graph.
b. Indicate on the graph how an increase in cB would shift the best-response functions and change the equilibrium.
c. Indicate on the graph where analogue to the Stackelberg equilibrium might be, with firm A choosing price first and then firm B. Is it better to be the first or the second mover when firms choose prices?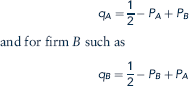
Explanation Verified
The demand curves for firm A and firm B ...
Intermediate Microeconomics and Its Application 12th Edition by Walter Nicholson,Christopher Snyder
Why don’t you like this exercise?
Other Minimum 8 character and maximum 255 character
Character 255


