Engineering Economy 7th Edition by Leland Blank ,Anthony Tarquin
Edition 7ISBN: 978-0073376301Engineering Economy 7th Edition by Leland Blank ,Anthony Tarquin
Edition 7ISBN: 978-0073376301 Exercise 8
Carl, an engineering colleague, estimated net cash flow after taxes (CFAT) for the project he is working on. The additional CFAT of $2800 in year 10 is the salvage value of capital assets. 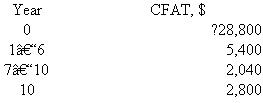 The PW value at the current MARR of 7% per year is
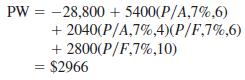
Carl believes the MARR will vary over a relatively narrow range, as will the CFAT, especially during the out years of 7 through 10. He is willing to accept the other estimates as certain. Use the following probability distribution assumptions for MARR and CFAT to perform a simulation-hand- or spreadsheet-based.
MARR. Uniform distribution over the range 6% to 10%.
CFAT, years 7 through 10. Uniform distribution over the range $1600 to $2400 for each year.
Plot the resulting PW distribution. Should the plan be accepted using decision making under certainty Under risk
The PW value at the current MARR of 7% per year is Carl believes the MARR will vary over a relatively narrow range, as will the CFAT, especially during the out years of 7 through 10. He is willing to accept the other estimates as certain. Use the following probability distribution assumptions for MARR and CFAT to perform a simulation-hand- or spreadsheet-based.
MARR. Uniform distribution over the range 6% to 10%.
CFAT, years 7 through 10. Uniform distribution over the range $1600 to $2400 for each year.
Plot the resulting PW distribution. Should the plan be accepted using decision making under certainty Under risk
Explanation Verified
19.23 Using a spreadsheet, the steps in ...
Engineering Economy 7th Edition by Leland Blank ,Anthony Tarquin
Why don’t you like this exercise?
Other Minimum 8 character and maximum 255 character
Character 255


