
Macroeconomics 9th Edition by David Colander
Edition 9ISBN: 978-0077501860Macroeconomics 9th Edition by David Colander
Edition 9ISBN: 978-0077501860 Exercise 38
Graph the following costs per unit, and answer the questions that follow. 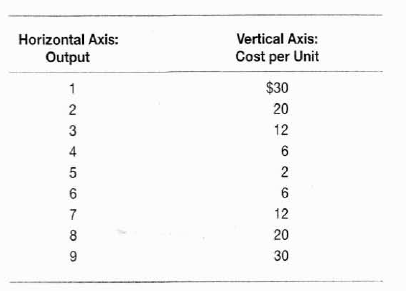
a. Is the relationship between cost per unit and output linear or nonlinear! Why:
b. In what range in output is the relationship inverse
In what range in output is the relationship direct
c. In what range in output is the slope negative
In what range in output is the slope positive
d. What is the slope between 1 and 2 units
Explanation Verified
The graph is a figure which shows the re...
Macroeconomics 9th Edition by David Colander
Why don’t you like this exercise?
Other Minimum 8 character and maximum 255 character
Character 255


