Essentials of Economics 2nd Edition by Campbell McConnell, Randy Grant, Stanley Brue
Edition 2ISBN: 978-0073511313Essentials of Economics 2nd Edition by Campbell McConnell, Randy Grant, Stanley Brue
Edition 2ISBN: 978-0073511313 Exercise 9
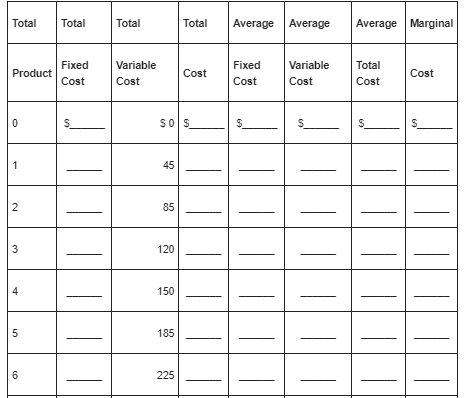
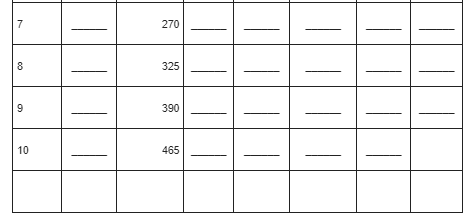
A firm has fixed costs of $60 and variable costs as indicated in the accompanying table.
Complete the table and check your calculations by referring to question 3 at the end of Chapter 7.
a. Graph the AFC, ATC, and MC curves. Why does the AFC curve slope continuously downward Why does the MC curve eventually slope upward Why does the MC curve intersect the ATC curve at its minimum point
b. Explain how the location of each curve graphed in question 9a would be altered if (1) total fixed cost had been $100 rather than $60 and (2) total variable cost had been $10 less at each level of output.
Explanation Verified
(a)
![]() It is also given that fixed cost ...
It is also given that fixed cost ...
Essentials of Economics 2nd Edition by Campbell McConnell, Randy Grant, Stanley Brue
Why don’t you like this exercise?
Other Minimum 8 character and maximum 255 character
Character 255


