
Understanding Basic Statistics 6th Edition by Charles Henry Brase,Corrinne Pellillo Brase
Edition 6ISBN: 978-1111827021Understanding Basic Statistics 6th Edition by Charles Henry Brase,Corrinne Pellillo Brase
Edition 6ISBN: 978-1111827021 Exercise 45
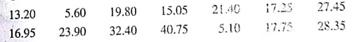
Archaeology: Ireland The Hill of Tara in Ireland is a place of great archaeological importance. This region has been occupied by people for more than 4000 years. Geomagnetic surveys detect subsurface anomalies in the earth's magnetic field. These surveys have led to many significant archaeological discoveries. After collecting data, the next step is to begin a statistical study. The following data measure magnetic susceptibility (centimeter-gram-second × 10 6 ) on two of the main grids of the Hill of Tara (Reference: Tara: An Archaeological Survey by Conor Newman, Royal Irish Academy, Dublin).
Grid E: x variable
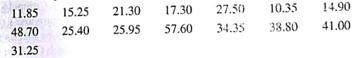
Grid H: y variable
(a) Compute x , x 2 , y , and for y 2.
(b) Use the results of part (a) to compute the sample mean, variance, and standard deviation for x and for y.
(c) Compute a 75% Chebyshev interval around the mean for x values and also for y values. Use the intervals to compare the magnetic susceptibility on the two grids. Higher numbers indicate higher magnetic susceptibility However, extreme values, high or low, could mean an anomaly and possible archaeological treasure.
(d) Interpretation Compute the sample coefficient of variation for each grid. Use the CV s to compare the two grids. If s represents variability in the signal (magnetic susceptibility) and
 represents the expected level of the signal, then
 can be thought of as a measure of the variability per unit of expected signal. Remember, a considerable variability in the signal (above or below average) might indicate buried artifacts. why, in this case, would a large CV be better, or at least more exciting Explain.
Grid E: x variable
Grid H: y variable
(a) Compute x , x 2 , y , and for y 2.
(b) Use the results of part (a) to compute the sample mean, variance, and standard deviation for x and for y.
(c) Compute a 75% Chebyshev interval around the mean for x values and also for y values. Use the intervals to compare the magnetic susceptibility on the two grids. Higher numbers indicate higher magnetic susceptibility However, extreme values, high or low, could mean an anomaly and possible archaeological treasure.
(d) Interpretation Compute the sample coefficient of variation for each grid. Use the CV s to compare the two grids. If s represents variability in the signal (magnetic susceptibility) and
represents the expected level of the signal, then can be thought of as a measure of the variability per unit of expected signal. Remember, a considerable variability in the signal (above or below average) might indicate buried artifacts. why, in this case, would a large CV be better, or at least more exciting Explain.Explanation Verified
a)
Given that,
Grid E:
x: 13.2 5.60 19.8...
Understanding Basic Statistics 6th Edition by Charles Henry Brase,Corrinne Pellillo Brase
Why don’t you like this exercise?
Other Minimum 8 character and maximum 255 character
Character 255


