
Understanding Basic Statistics 6th Edition by Charles Henry Brase,Corrinne Pellillo Brase
Edition 6ISBN: 978-1111827021Understanding Basic Statistics 6th Edition by Charles Henry Brase,Corrinne Pellillo Brase
Edition 6ISBN: 978-1111827021 Exercise 36
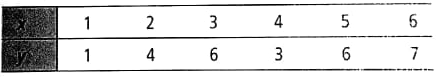
Expand your Knowledge : Effect of Scale on Scatter Diagram The initial visual impact of a scatter diagram depends on the scales used on the x and y axes. Consider the following data:
(a) Make a scatter diagram using the same scale on both the x and y axes (i.e., make sure the unit lengths on the two axes are equal).
(b) Make a scatter diagram using scale on the y axis that is twice as long as that on the x axis.
(c) make a scatter diagram using a scale on the y axis that is half as long as that on the x axis.
(d) On the of the three graphs, draw the straight line that you think best fits the data points. How do the slopes (or directions) of the three lines appear to change Note: The actual slopes will be the same; they just appear different because of the choice of scale factors.
Explanation Verified
(a)
Scatter Diagram:
![]() • In the above s...
• In the above s...
Understanding Basic Statistics 6th Edition by Charles Henry Brase,Corrinne Pellillo Brase
Why don’t you like this exercise?
Other Minimum 8 character and maximum 255 character
Character 255


