
Understanding Basic Statistics 6th Edition by Charles Henry Brase,Corrinne Pellillo Brase
Edition 6ISBN: 978-1111827021Understanding Basic Statistics 6th Edition by Charles Henry Brase,Corrinne Pellillo Brase
Edition 6ISBN: 978-1111827021 Exercise 29
Critical Thinking: Interpreting Computer Printouts We use the form = a + bx for the least-squares line. In some computer printouts, the least-squares equation is not given directly. Instead, the value of the constant a is given, and the coefficient b of the explanatory or predictor variable is displayed. Sometimes a is referred to as the constant, and sometimes as the intercept. Data from Climatology Report No. 77-3 of the Department of Atmospheric Science, Colorado State University, Shows the relationship between elevation (in thousands of feet) and average number of frost-free days per year in Colorado locations.
A Minitab printout provides
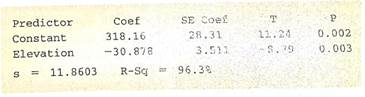
Notice that "Elevation" is listed under "Predictor." This means that elevation is the explanatory variable x. Its coefficients is the slope b , "Constant" refers to a in the equation = a + bx.
(a) Use the printout to write the least-squares equation.
(b) For each 1000-ffot increase in elevation, how many fewer frost-free days are predicted
(c) The printout gives the value of the coefficient of determination r 2. What is the value of r Be sure to give the correct sign for r based on the sign of b.
(d) Interpretation What percentage of the variation in y can be explained by the corresponding variation in x and the least-squares line What percentage is unexplained
A Minitab printout provides
Notice that "Elevation" is listed under "Predictor." This means that elevation is the explanatory variable x. Its coefficients is the slope b , "Constant" refers to a in the equation = a + bx.
(a) Use the printout to write the least-squares equation.
(b) For each 1000-ffot increase in elevation, how many fewer frost-free days are predicted
(c) The printout gives the value of the coefficient of determination r 2. What is the value of r Be sure to give the correct sign for r based on the sign of b.
(d) Interpretation What percentage of the variation in y can be explained by the corresponding variation in x and the least-squares line What percentage is unexplained
Explanation Verified
Here is a summary chart of data showing ...
Understanding Basic Statistics 6th Edition by Charles Henry Brase,Corrinne Pellillo Brase
Why don’t you like this exercise?
Other Minimum 8 character and maximum 255 character
Character 255


