
Understanding Basic Statistics 6th Edition by Charles Henry Brase,Corrinne Pellillo Brase
Edition 6ISBN: 978-1111827021Understanding Basic Statistics 6th Edition by Charles Henry Brase,Corrinne Pellillo Brase
Edition 6ISBN: 978-1111827021 Exercise 12
Draw a scatter diagram displaying the data.
(b)Verify the given sums x , y , x 2 , y 2 , and xy , and the value of the sample correlation coefficient r.
(c) Find
 , a , and b. Then find the equation of the least-squares line = a + bx.
(d) Graph the least-squares line on your scatter diagram. Be sure to use the point(
 ) as one of the points on the line.
(e) Interpretation Find the value of the coefficient of determination r 2. What percentage of the variation in y can be explained by the corresponding variation in x and the least-squares line What percentage is unexplained Answers may vary slightly due to rounding.
Basketball: Fouls Data for this problem are based on information from STATS Basketball Scoreboard. It is thought that basketball teams that make too many fouls in a game tend to lose the game even if they otherwise play well. Let x be the number of fouls that were more than (i.e., over and above) the number of fouls made the opposing team made. Let y be the percentage of times the team with the larger number of fouls won the game.
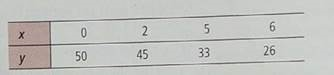
Complete parts (a) through (e), given x = 13, y = 154, x ² = 65, y ² = 6290, xy = 411, and r -0.988.
(f) If a team had x = 4 fouls over and above the opposing team, what does the least-squares equation forecast for y
(b)Verify the given sums x , y , x 2 , y 2 , and xy , and the value of the sample correlation coefficient r.
(c) Find
, a , and b. Then find the equation of the least-squares line = a + bx.(d) Graph the least-squares line on your scatter diagram. Be sure to use the point(
) as one of the points on the line.(e) Interpretation Find the value of the coefficient of determination r 2. What percentage of the variation in y can be explained by the corresponding variation in x and the least-squares line What percentage is unexplained Answers may vary slightly due to rounding.
Basketball: Fouls Data for this problem are based on information from STATS Basketball Scoreboard. It is thought that basketball teams that make too many fouls in a game tend to lose the game even if they otherwise play well. Let x be the number of fouls that were more than (i.e., over and above) the number of fouls made the opposing team made. Let y be the percentage of times the team with the larger number of fouls won the game.
Complete parts (a) through (e), given x = 13, y = 154, x ² = 65, y ² = 6290, xy = 411, and r -0.988.
(f) If a team had x = 4 fouls over and above the opposing team, what does the least-squares equation forecast for y
Explanation Verified
Let x be the number of fouls more than t...
Understanding Basic Statistics 6th Edition by Charles Henry Brase,Corrinne Pellillo Brase
Why don’t you like this exercise?
Other Minimum 8 character and maximum 255 character
Character 255


