
Understanding Basic Statistics 6th Edition by Charles Henry Brase,Corrinne Pellillo Brase
Edition 6ISBN: 978-1111827021Understanding Basic Statistics 6th Edition by Charles Henry Brase,Corrinne Pellillo Brase
Edition 6ISBN: 978-1111827021 Exercise 11
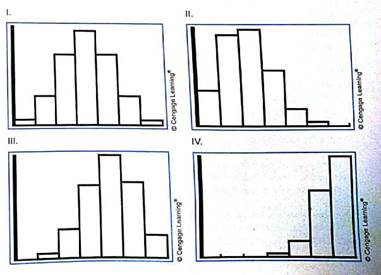
Binomial Distributions: Histograms Figure 6-6 shows histograms of several binomial distributions with n = 6 trials. Match the given probability of success with the best graph.
(a) p = 0.30 goes with graph __________.
(b) p = 0.50 goes with graph.__________.
(c) p = 0.65 goes with graph__________.
(d) p = 0.90 goes with graph___________.
(e) In general, when the probability of success p is close to 0.5, would you say that the graph is more symmetrical or more skewed In general, when the probability of success p is close to I, would you say that the graph is skewed to the right or to the left What about when p is close to 0
Explanation Verified
Here are 4 histograms for a binomial dis...
Understanding Basic Statistics 6th Edition by Charles Henry Brase,Corrinne Pellillo Brase
Why don’t you like this exercise?
Other Minimum 8 character and maximum 255 character
Character 255


