
Understanding Basic Statistics 6th Edition by Charles Henry Brase,Corrinne Pellillo Brase
Edition 6ISBN: 978-1111827021Understanding Basic Statistics 6th Edition by Charles Henry Brase,Corrinne Pellillo Brase
Edition 6ISBN: 978-1111827021 Exercise 46
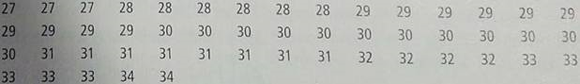
Critical Thinking: Normality Consider the following data. The summary statistics, histogram, and normal quantile plot were generated by Minitab.
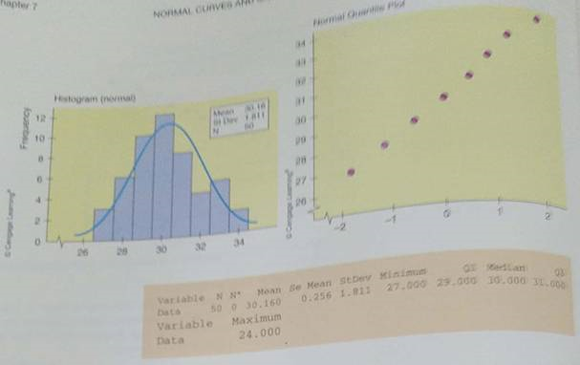
(a) Does the histogram indicate normality for the data distribution Explain.
(b) Does the normal quantile plot indicate normality for the data distribution Explain.
(c) Compute the interquartile range and check for outliers.
(d) Compute Person's index. Does the index value indicate skewness
(e) Using parts (a) through (d), would you say the data are from a normal distribution
Explanation Verified
A set of 50 data points is summarized in...
Understanding Basic Statistics 6th Edition by Charles Henry Brase,Corrinne Pellillo Brase
Why don’t you like this exercise?
Other Minimum 8 character and maximum 255 character
Character 255


