
Understanding Basic Statistics 6th Edition by Charles Henry Brase,Corrinne Pellillo Brase
Edition 6ISBN: 978-1111827021Understanding Basic Statistics 6th Edition by Charles Henry Brase,Corrinne Pellillo Brase
Edition 6ISBN: 978-1111827021 Exercise 54
Crime Rate: Demo The following data represent crime rates per 1000 population for a random sample of 46 Denver neighborhoods (Reference: The Piton Foundation, Denver, Colorado).
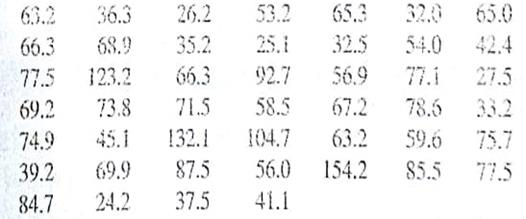
(a) Use a calculator with mean and sample standard deviation keys to verify that
 64.2 and s 27.9 crimes per 1000 population.
(b) Let us say that the preceding data are representative of the population crime rates in Denver neighborhoods. Compute an 80% confidence interval for , the population mean crime rate for all Denver neighborhoods.
(c) Interpretation Suppose you are advising the police department about police patrol assignments. One neighborhood has a crime rate of 57 crimes per 1000 population. Do you think that this rate is below the average population crime rate and that fewer patrols could safely be assigned to this neighborhood Use the confidence interval to justify your answer.
(d) Interpretation Another neighborhood has a crime rate of 75 crimes per 1000 population. Does this crime rate seem to be higher than the population average Would you recommend assigning more patrols to this neighborhood Use the confidence interval to justify your answer.
(e) Repeat parts (b), (c), and (d) for a 95% confidence interval.
(f) Check Requirement In previous problems, we assumed the x distribution was normal or approximately normal. Do we need to make such an assumption in this problem Why or why not Hint: See the central limit theorem in Section 7.5.
(a) Use a calculator with mean and sample standard deviation keys to verify that
64.2 and s 27.9 crimes per 1000 population.(b) Let us say that the preceding data are representative of the population crime rates in Denver neighborhoods. Compute an 80% confidence interval for , the population mean crime rate for all Denver neighborhoods.
(c) Interpretation Suppose you are advising the police department about police patrol assignments. One neighborhood has a crime rate of 57 crimes per 1000 population. Do you think that this rate is below the average population crime rate and that fewer patrols could safely be assigned to this neighborhood Use the confidence interval to justify your answer.
(d) Interpretation Another neighborhood has a crime rate of 75 crimes per 1000 population. Does this crime rate seem to be higher than the population average Would you recommend assigning more patrols to this neighborhood Use the confidence interval to justify your answer.
(e) Repeat parts (b), (c), and (d) for a 95% confidence interval.
(f) Check Requirement In previous problems, we assumed the x distribution was normal or approximately normal. Do we need to make such an assumption in this problem Why or why not Hint: See the central limit theorem in Section 7.5.
Explanation Verified
(a)
For the given data the sample mean i...
Understanding Basic Statistics 6th Edition by Charles Henry Brase,Corrinne Pellillo Brase
Why don’t you like this exercise?
Other Minimum 8 character and maximum 255 character
Character 255


