
Understanding Basic Statistics 6th Edition by Charles Henry Brase,Corrinne Pellillo Brase
Edition 6ISBN: 978-1111827021Understanding Basic Statistics 6th Edition by Charles Henry Brase,Corrinne Pellillo Brase
Edition 6ISBN: 978-1111827021 Exercise 23
Please provide the following information for Problems 11-22, part (a):
(i) What is the level of significance State the null and alternate hypotheses.
(ii) Check Requirements What sampling distribution will you use What assumptions are you making What is the value of the sample test statistic
(iii) Find (or estimate) the P -value. Sketch the sampling distribution and show the area corresponding to the P -value.
(iv) Based on your answers in parts (i) - (iii), will you reject or fail to reject the null hypothesis Are the data statistically significant at level a
(v) Interpret your conclusion in the context of the application.
Note: For degrees of freedom d.f. not in the Student's t table, use the closest d.f. that is smaller. In some situations, this choice of d.f. may increase the P -value a small amount, and therefore produce a slightly more "conservative" answer.
Answers may vary due to rounding.
Management: Lost Time In her book Red Ink Behaviors , Jean Hollands reports on the assessment of leading Silicon Valley companies regarding a manager's lost time due to inappropriate behavior of employees. Consider the following independent random variables. The variable x 1 measures manager's hours per week lost due to hot tempers, flaming e-mails, and general unproductive tensions:
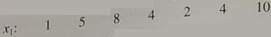
The variable x 2 measures manager's hours per week lost due to disputes regarding technical workers' superior attitudes that their colleagues are "dumb and dispensable":

Use a calculator with sample mean and standard deviation keys to verify that
 , s 1 3.18,
 , and s 2 2.88.
(a) Does the information indicate that the population mean time lost due to hot tempers is different (either way) from population mean time lost due to disputes arising from technical workers' superior attitudes Use = 0.05. Assume that the two lost-time population distributions are mound-shaped and symmetrical.
(b) Find a 95% confidence interval for 1 2. Explain the meaning of the confidence interval in the context of the problem.
(i) What is the level of significance State the null and alternate hypotheses.
(ii) Check Requirements What sampling distribution will you use What assumptions are you making What is the value of the sample test statistic
(iii) Find (or estimate) the P -value. Sketch the sampling distribution and show the area corresponding to the P -value.
(iv) Based on your answers in parts (i) - (iii), will you reject or fail to reject the null hypothesis Are the data statistically significant at level a
(v) Interpret your conclusion in the context of the application.
Note: For degrees of freedom d.f. not in the Student's t table, use the closest d.f. that is smaller. In some situations, this choice of d.f. may increase the P -value a small amount, and therefore produce a slightly more "conservative" answer.
Answers may vary due to rounding.
Management: Lost Time In her book Red Ink Behaviors , Jean Hollands reports on the assessment of leading Silicon Valley companies regarding a manager's lost time due to inappropriate behavior of employees. Consider the following independent random variables. The variable x 1 measures manager's hours per week lost due to hot tempers, flaming e-mails, and general unproductive tensions:
The variable x 2 measures manager's hours per week lost due to disputes regarding technical workers' superior attitudes that their colleagues are "dumb and dispensable":
Use a calculator with sample mean and standard deviation keys to verify that
, s 1 3.18, , and s 2 2.88.(a) Does the information indicate that the population mean time lost due to hot tempers is different (either way) from population mean time lost due to disputes arising from technical workers' superior attitudes Use = 0.05. Assume that the two lost-time population distributions are mound-shaped and symmetrical.
(b) Find a 95% confidence interval for 1 2. Explain the meaning of the confidence interval in the context of the problem.
Explanation Verified
(a)
Let
![]() and
and
![]() be the means of the di...
be the means of the di...
Understanding Basic Statistics 6th Edition by Charles Henry Brase,Corrinne Pellillo Brase
Why don’t you like this exercise?
Other Minimum 8 character and maximum 255 character
Character 255


