
Understanding Basic Statistics 6th Edition by Charles Henry Brase,Corrinne Pellillo Brase
Edition 6ISBN: 978-1111827021Understanding Basic Statistics 6th Edition by Charles Henry Brase,Corrinne Pellillo Brase
Edition 6ISBN: 978-1111827021 Exercise 56
For Problems 9-19, please provide the following information:
(a) What is the level of significance State the null and alternate hypotheses.
(b) Check Requirements Find the value of the chi-square statistic for the sample. Are all the expected frequencies greater than 5 What sampling distribution will you use What are the degrees of freedom
(c) Find or estimate the P -value of the sample test statistic.
(d) Based on your answers in parts (a)-(c), will you reject or fail to reject the null hypothesis of independence
(e) Interpret your conclusion in the context of the application.
Use the expected values E to the hundredths place.
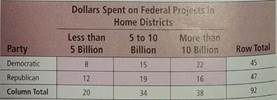
Political Affiliation: Spending Two random samples were drawn from members of the U.S. Congress. One sample was taken from members who are Democrats and the other from members who are Republicans. For each sample, the number of dollars spent on federal projects in each congressperson's home district was recorded.
(i) Make a cluster bar graph showing the percentage of Congress members from each party who spent each designated amount in their respective home districts.
(ii) Use a 1% level of significance to test whether congressional members of each political party spent designated amounts in the same proportions.
(a) What is the level of significance State the null and alternate hypotheses.
(b) Check Requirements Find the value of the chi-square statistic for the sample. Are all the expected frequencies greater than 5 What sampling distribution will you use What are the degrees of freedom
(c) Find or estimate the P -value of the sample test statistic.
(d) Based on your answers in parts (a)-(c), will you reject or fail to reject the null hypothesis of independence
(e) Interpret your conclusion in the context of the application.
Use the expected values E to the hundredths place.
Political Affiliation: Spending Two random samples were drawn from members of the U.S. Congress. One sample was taken from members who are Democrats and the other from members who are Republicans. For each sample, the number of dollars spent on federal projects in each congressperson's home district was recorded.
(i) Make a cluster bar graph showing the percentage of Congress members from each party who spent each designated amount in their respective home districts.
(ii) Use a 1% level of significance to test whether congressional members of each political party spent designated amounts in the same proportions.
Explanation Verified
i)
The given problem explains that the p...
Understanding Basic Statistics 6th Edition by Charles Henry Brase,Corrinne Pellillo Brase
Why don’t you like this exercise?
Other Minimum 8 character and maximum 255 character
Character 255


