
Understanding Basic Statistics 6th Edition by Charles Henry Brase,Corrinne Pellillo Brase
Edition 6ISBN: 978-1111827021Understanding Basic Statistics 6th Edition by Charles Henry Brase,Corrinne Pellillo Brase
Edition 6ISBN: 978-1111827021 Exercise 47
For Problems 5-14, please provide the following information.
(a) What is the level of significance State the null and alternate hypotheses.
(b) Find the value of the chi-square statistic for the sample. Are all the expected frequencies greater than 5 What sampling distribution will you use What are the degrees of freedom
(c) Find or estimate the P -value of the sample test statistic.
(d) Based on your answers in parts (a)-(c), will you reject or fail to reject the null hypothesis that the population fits the specified distribution of categories
(e) Interpret your conclusion in the context of the application.
Census: California The accuracy of a census report on a city in southern California was questioned by some government officials. A random sample of 1215 people living in the city was used to check the report, and the results are shown next:
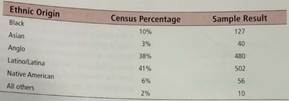
Using a 1% level of significance, test the claim that the census distribution and the sample distribution agree.
(a) What is the level of significance State the null and alternate hypotheses.
(b) Find the value of the chi-square statistic for the sample. Are all the expected frequencies greater than 5 What sampling distribution will you use What are the degrees of freedom
(c) Find or estimate the P -value of the sample test statistic.
(d) Based on your answers in parts (a)-(c), will you reject or fail to reject the null hypothesis that the population fits the specified distribution of categories
(e) Interpret your conclusion in the context of the application.
Census: California The accuracy of a census report on a city in southern California was questioned by some government officials. A random sample of 1215 people living in the city was used to check the report, and the results are shown next:
Using a 1% level of significance, test the claim that the census distribution and the sample distribution agree.
Explanation Verified
(a)
![]() The census distribution and the ci...
The census distribution and the ci...
Understanding Basic Statistics 6th Edition by Charles Henry Brase,Corrinne Pellillo Brase
Why don’t you like this exercise?
Other Minimum 8 character and maximum 255 character
Character 255


