
Labor Economics 5th Edition by George Borjas
Edition 5ISBN: 978-0073511368Labor Economics 5th Edition by George Borjas
Edition 5ISBN: 978-0073511368 Exercise 10
Consider the demand for and supply of risky jobs.
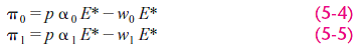
a. Derive the algebra that leads from equations (5-4) and (5-5) to equation (5-6).
Reference Equations (5-4), (5-5) and (5-6)

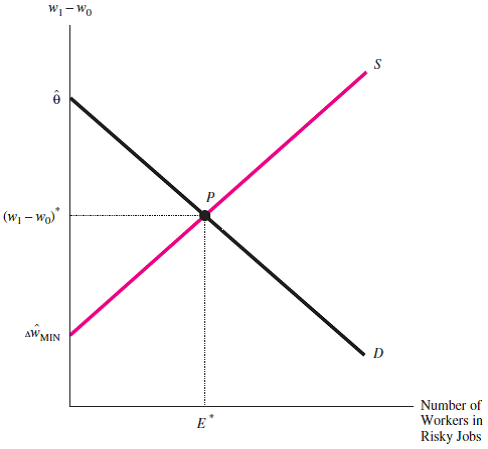
b. Describe why the supply curve in Figure 5-2 is upward sloping. How does your explanation incorporate Why
Reference Figure 5-2

c. Using a graph similar to Figure 5-2 , demonstrate how the number of dirty jobs changes as technological advances allow the cost of making worsites cleaner to fall for all firms.
Reference Figure 5-2
a. Derive the algebra that leads from equations (5-4) and (5-5) to equation (5-6).
Reference Equations (5-4), (5-5) and (5-6)
b. Describe why the supply curve in Figure 5-2 is upward sloping. How does your explanation incorporate Why
Reference Figure 5-2
c. Using a graph similar to Figure 5-2 , demonstrate how the number of dirty jobs changes as technological advances allow the cost of making worsites cleaner to fall for all firms.
Reference Figure 5-2
Explanation Verified
a)The necessary algebraic steps are as f...
Labor Economics 5th Edition by George Borjas
Why don’t you like this exercise?
Other Minimum 8 character and maximum 255 character
Character 255


