
The Essentials of Statistics 3rd Edition by Joseph Healey
Edition 3ISBN: 978-1111831585The Essentials of Statistics 3rd Edition by Joseph Healey
Edition 3ISBN: 978-1111831585 Exercise 1
PS: In problem 13.1, data regarding voter turnout in five cities was presented. For the sake of convenience, the data for three of the variables are presented again here along with descriptive statistics and zero-order correlations
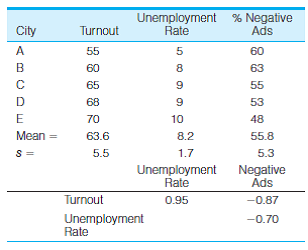
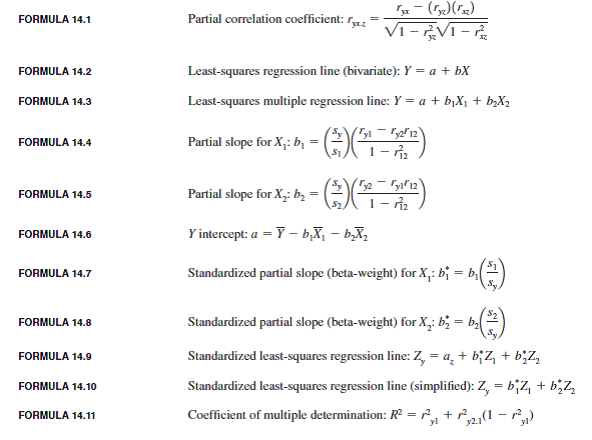
a. Compute the partial correlation coefficient for the relationship between turnout (Y) and unemployment (X) while controlling for the effect of negative advertising (Z). What effect does this control variable have on the bivariate relationship? Is the relationship between turnout and unemployment direct? (HINT: Use Formula 14.1 and see "Types of Relationships" in the section on partial correlation.)
b. Compute the partial correlation coefficient for the relationship between turnout (Y) and negative advertising (X) while controlling for the effect of unemployment (Z). What effect does this have on the bivariate relationship? Is the relationship between turnout and negative advertising direct? (Hint: Use Formula 14.1 and see "Types of Relationships" in the section on partial correlation. You will need this partial correlation to compute the multiple correlation coefficient.)
c. Find the unstandardized multiple regression equation with unemployment (X 1 ) and negative ads (X 2 ) as the independent variables. What turnout would be expected in a city in which the unemployment rate was 10% and 75% of the campaign ads were negative? (Hint: Use Formulas 14.4 and 14.5 to compute the partial slopes and then use Formula 14.6 to find a, the Y intercept. The regression line is stated in Formula 14.3. Substitute 10 for X 1 and 75 for X 2 to compute predicted Y.)
d. Compute beta-weights for each independent variable. Which has the stronger impact on turnout? (Hint: Use Formulas 14.7 and 14.8 to calculate the beta-weights.)
e. Compute the multiple correlation co-efficient (R) and the coefficient of multiple determination (R 2 ). How much of the variance in voter turnout is explained by the two independent variables? (Hint: Use Formula 14.11. You calculated r 2 y 2.1 in part b of this problem.)
f. Write a paragraph summarizing your conclusions about the relationships among these three variables.
Problem 13.1:
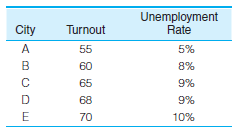
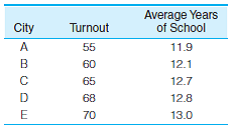
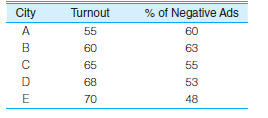
PS: Why does voter turnout vary from election to election? For municipal elections in five different cities, information has been gathered on the percentage of registered voters who actually voted, unemployment rate, average years of education for the city, and the percentage of all political ads that used "negative campaigning" (personal attacks, negative portrayals of the opponent's record, etc.). For each relationship:
a. Draw a scattergram and a freehand regression line.
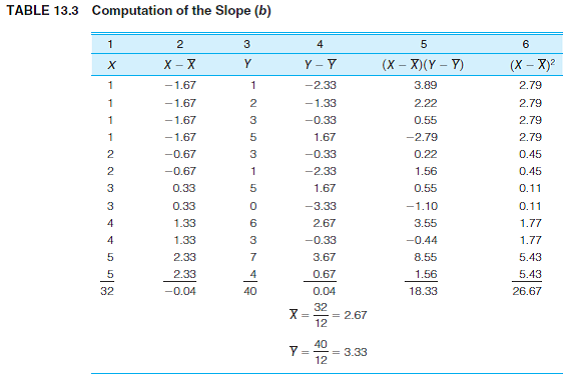
b. Compute the slope (b) and then find the Y intercept (a). (Hint: Remember to compute b before computing a. A computing table like Table 13.3 is highly recommended.)
c. State the least-squares regression line and then predict the voter turnout for a city in which the unemployment rate was 12%-a city in which the average years of schooling was 11, and a city that had an election in which 90% of the ads were negative.
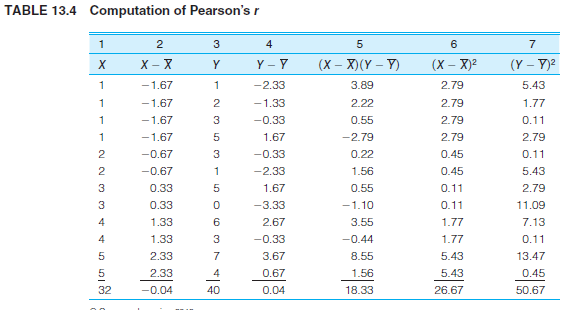
d. Compute r and r 2. (Hint: A computing table like Table 13.4 is highly recommended. If you constructed one for computing b, you already have most of the quantities you will need to solve for r.)
e. Describe the strength and direction of each relationship in a sentence or two. Which factor had the strongest effect on turnout?
Turnout and Unemployment
Turnout and Level of Education
Turnout and Negative Campaigning
a. Compute the partial correlation coefficient for the relationship between turnout (Y) and unemployment (X) while controlling for the effect of negative advertising (Z). What effect does this control variable have on the bivariate relationship? Is the relationship between turnout and unemployment direct? (HINT: Use Formula 14.1 and see "Types of Relationships" in the section on partial correlation.)
b. Compute the partial correlation coefficient for the relationship between turnout (Y) and negative advertising (X) while controlling for the effect of unemployment (Z). What effect does this have on the bivariate relationship? Is the relationship between turnout and negative advertising direct? (Hint: Use Formula 14.1 and see "Types of Relationships" in the section on partial correlation. You will need this partial correlation to compute the multiple correlation coefficient.)
c. Find the unstandardized multiple regression equation with unemployment (X 1 ) and negative ads (X 2 ) as the independent variables. What turnout would be expected in a city in which the unemployment rate was 10% and 75% of the campaign ads were negative? (Hint: Use Formulas 14.4 and 14.5 to compute the partial slopes and then use Formula 14.6 to find a, the Y intercept. The regression line is stated in Formula 14.3. Substitute 10 for X 1 and 75 for X 2 to compute predicted Y.)
d. Compute beta-weights for each independent variable. Which has the stronger impact on turnout? (Hint: Use Formulas 14.7 and 14.8 to calculate the beta-weights.)
e. Compute the multiple correlation co-efficient (R) and the coefficient of multiple determination (R 2 ). How much of the variance in voter turnout is explained by the two independent variables? (Hint: Use Formula 14.11. You calculated r 2 y 2.1 in part b of this problem.)
f. Write a paragraph summarizing your conclusions about the relationships among these three variables.
Problem 13.1:
PS: Why does voter turnout vary from election to election? For municipal elections in five different cities, information has been gathered on the percentage of registered voters who actually voted, unemployment rate, average years of education for the city, and the percentage of all political ads that used "negative campaigning" (personal attacks, negative portrayals of the opponent's record, etc.). For each relationship:
a. Draw a scattergram and a freehand regression line.
b. Compute the slope (b) and then find the Y intercept (a). (Hint: Remember to compute b before computing a. A computing table like Table 13.3 is highly recommended.)
c. State the least-squares regression line and then predict the voter turnout for a city in which the unemployment rate was 12%-a city in which the average years of schooling was 11, and a city that had an election in which 90% of the ads were negative.
d. Compute r and r 2. (Hint: A computing table like Table 13.4 is highly recommended. If you constructed one for computing b, you already have most of the quantities you will need to solve for r.)
e. Describe the strength and direction of each relationship in a sentence or two. Which factor had the strongest effect on turnout?
Turnout and Unemployment
Turnout and Level of Education
Turnout and Negative Campaigning
Explanation Verified
(a)Let X be the dependent variable (unem...
The Essentials of Statistics 3rd Edition by Joseph Healey
Why don’t you like this exercise?
Other Minimum 8 character and maximum 255 character
Character 255


