Business Mathematics 13th Edition by Gary Clendenen,Stanley Salzman
Edition 13ISBN: 978-0321955050Business Mathematics 13th Edition by Gary Clendenen,Stanley Salzman
Edition 13ISBN: 978-0321955050 Exercise 1
YACHT CONSTRUCTION Complete this balance sheet using vertical analysis. Round to the nearest tenth of a percent. (See Example.)
Comparing Balance Sheets
First, do a vertical analysis for the 2010 and 2011 balance sheets for Apple by calculating each value as a percent of the total assets for the respective year (round percents to the nearest tenth). Then compare the percents to identify the changes.
SOLUTION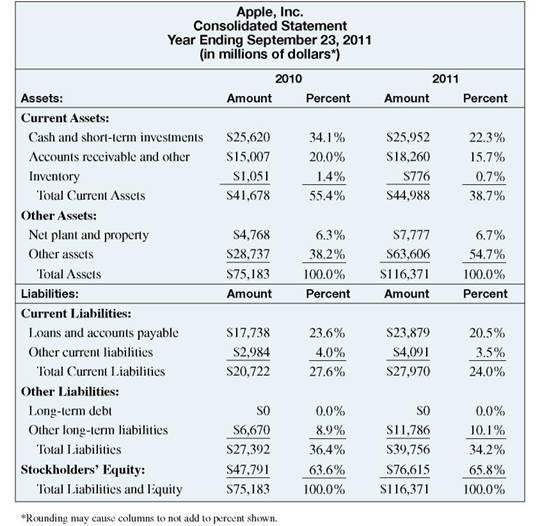
Notice that stockholders' equity increased significantly from $47,791,000,000 to $76,615,000,000 in only one year. Wow, what an amazing growth story! Cash and short-term investments fell from 34.1, of total assets in 2010 to 22.3% of total assets in 2011, but the firm still had a lot of cash and short-term investments in 2011 at $25,952,000,000.
A careful investor would want to follow up to find out why other assets increased from 38.2% of total assets in 2010 to 54.7% of total assets in 2011. It would be prudent to also ask whether this was a one-time increase, or whether it indicates a long-term trend.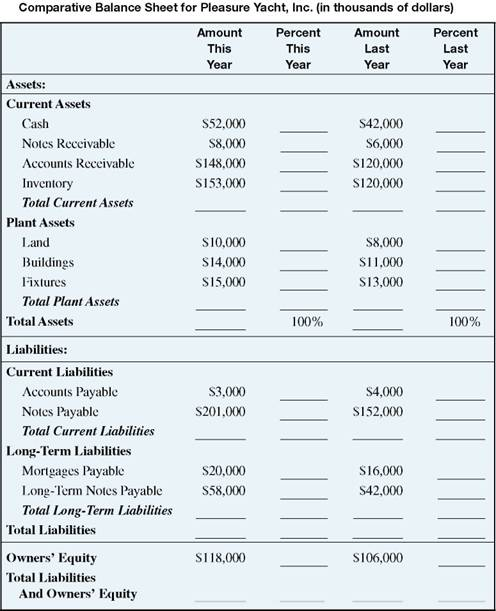
Explanation Verified
Read the table from the top to the botto...
Business Mathematics 13th Edition by Gary Clendenen,Stanley Salzman
Why don’t you like this exercise?
Other Minimum 8 character and maximum 255 character
Character 255


