Essentials of Economics 8th Edition by Bradley Schiller
Edition 8ISBN: 978-0073511399Essentials of Economics 8th Edition by Bradley Schiller
Edition 8ISBN: 978-0073511399 Exercise 4
The following schedule provides information with which to draw both an aggregate demand curve and an aggregate supply curve. Both curves are assumed to be straight lines.
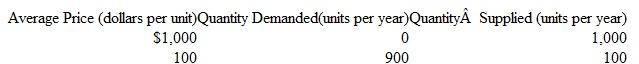 ( a )At what price level does equilibrium occur?
( b )What curve would have shifted if a new equilibrium were to occur at an output level of 700 and a price level of $700?
( c )What curve would have shifted if a new equilibrium were to occur at an output level of 700 and a price level of $500?
( d )What curve would have shifted if a new equilibrium were to occur at an output level of 700 and a price level of $300?
( e )Compared to the initial equilibrium ( a ), how have the outcomes in ( b ), ( c ), and ( d ) changed price levels or output?
( a )At what price level does equilibrium occur?( b )What curve would have shifted if a new equilibrium were to occur at an output level of 700 and a price level of $700?
( c )What curve would have shifted if a new equilibrium were to occur at an output level of 700 and a price level of $500?
( d )What curve would have shifted if a new equilibrium were to occur at an output level of 700 and a price level of $300?
( e )Compared to the initial equilibrium ( a ), how have the outcomes in ( b ), ( c ), and ( d ) changed price levels or output?
Explanation Verified
The data is for aggregate demand and agg...
Essentials of Economics 8th Edition by Bradley Schiller
Why don’t you like this exercise?
Other Minimum 8 character and maximum 255 character
Character 255


