
Economics for Today 9th Edition by Irvin Tucker
Edition 9ISBN: 978-1305507111Economics for Today 9th Edition by Irvin Tucker
Edition 9ISBN: 978-1305507111 Exercise 46
Exhibit A-9 represents a three-variable relationship. As the annual income of consumers rises from $30,000 (line B) to $50,000 (line A), the result is a
A) rightward movement along each curve.
B) leftward movement along each curve.
C) rightward shift in curve B to curve A.
D) leftward shift in curve A to curve B.
EXHIBIT A-9 Multi-Curve Graph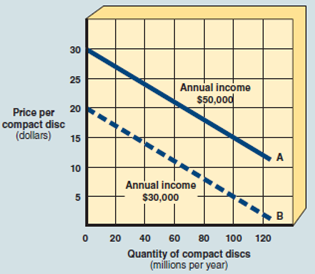
A) rightward movement along each curve.
B) leftward movement along each curve.
C) rightward shift in curve B to curve A.
D) leftward shift in curve A to curve B.
EXHIBIT A-9 Multi-Curve Graph
Explanation Verified
In case of demand curve quantity that is...
Economics for Today 9th Edition by Irvin Tucker
Why don’t you like this exercise?
Other Minimum 8 character and maximum 255 character
Character 255


