
Ecology: Concepts and Applications 4th Edition by Manual Molles
Edition 4ISBN: 978-0073050829Ecology: Concepts and Applications 4th Edition by Manual Molles
Edition 4ISBN: 978-0073050829 Exercise 1
The following data (Preston 1962a) give the area and number of bird species on islands in the West Indies:
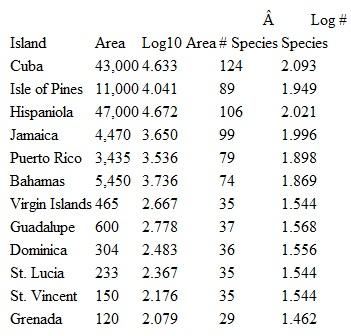 The numbers are expressed in two ways: as simple measurements and counts and as the logarithms of area and numbers of species. Use these data to plot your own species-area relationship. Plot area on the horizontal axis and number of species on the vertical axis. First plot the simple measurements of area and species number on one graph, and then plot the logarithms of area and species number on another graph. Which gives you the tightest relationship between area and species richness?
The numbers are expressed in two ways: as simple measurements and counts and as the logarithms of area and numbers of species. Use these data to plot your own species-area relationship. Plot area on the horizontal axis and number of species on the vertical axis. First plot the simple measurements of area and species number on one graph, and then plot the logarithms of area and species number on another graph. Which gives you the tightest relationship between area and species richness?Explanation Verified
The plot of the logarithms of ...
Ecology: Concepts and Applications 4th Edition by Manual Molles
Why don’t you like this exercise?
Other Minimum 8 character and maximum 255 character
Character 255


