
Genetics - Analysis and Principles 3rd Edition by Robert Brooker
Edition 3ISBN: 978-0071287647Genetics - Analysis and Principles 3rd Edition by Robert Brooker
Edition 3ISBN: 978-0071287647 Exercise 4
For all seven characters described in the data of Figure 2.5, Mendel allowed the F 2 plants to self-fertilize. He found that when F 2 plants with recessive traits were crossed to each other, they always bred true. However, when F 2 plants with dominant traits were crossed, some bred true but others did not. A summary of Mendel's results is shown here.
The Ratio of True-Breeding and Non-True-Breeding Parents of the F 2 Generation
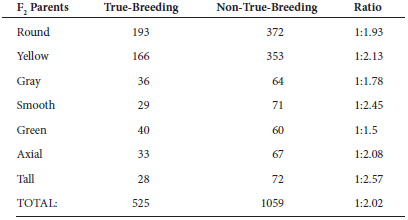
When considering the data in this table, keep in mind that it describes the characteristics of the F 2 generation parents that had displayed a dominant phenotype. These data were deduced by analyzing the outcome of the F 3 generation. Based on Mendel's laws, explain the 1:2 ratio obtained in these data.
FIGURE 2.5 Mendel's analysis of single-factor crosses.
Starting material: Mendel began his experiments with true-breeding strains of pea plants that varied in only one of seven different characters (see Figure 2.4).
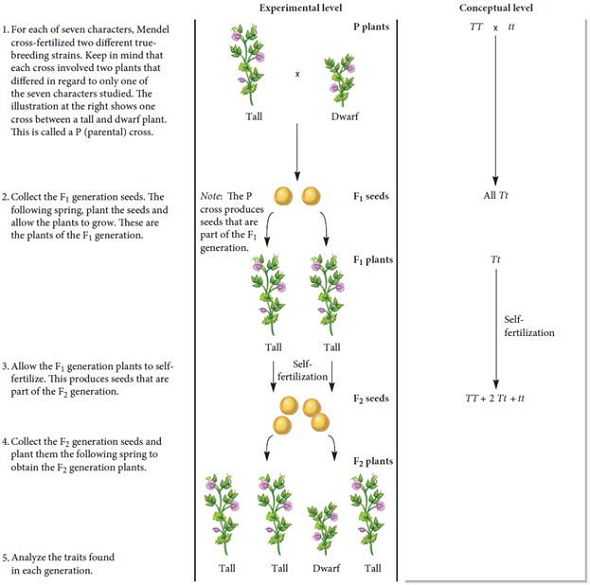
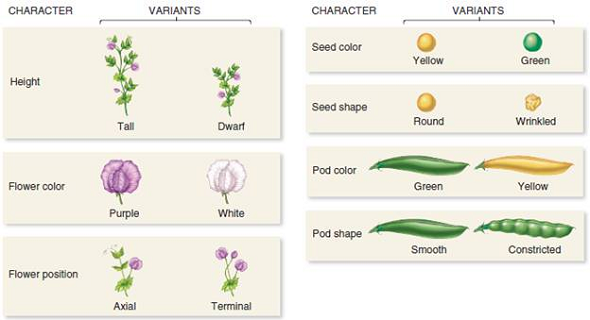
FIGURE 2.4 An illustration of the seven characters that Mendel studied. Each character was found as two variants that were decisively different from each other.
The Ratio of True-Breeding and Non-True-Breeding Parents of the F 2 Generation
When considering the data in this table, keep in mind that it describes the characteristics of the F 2 generation parents that had displayed a dominant phenotype. These data were deduced by analyzing the outcome of the F 3 generation. Based on Mendel's laws, explain the 1:2 ratio obtained in these data.
FIGURE 2.5 Mendel's analysis of single-factor crosses.
Starting material: Mendel began his experiments with true-breeding strains of pea plants that varied in only one of seven different characters (see Figure 2.4).
FIGURE 2.4 An illustration of the seven characters that Mendel studied. Each character was found as two variants that were decisively different from each other.
Explanation Verified
In the below table, the dominant phenoty...
Genetics - Analysis and Principles 3rd Edition by Robert Brooker
Why don’t you like this exercise?
Other Minimum 8 character and maximum 255 character
Character 255


