Basic College Mathematics 9th Edition by Margaret Lial,Stanley Salzman,Diana Hestwood
Edition 9ISBN: 978-0321914514Basic College Mathematics 9th Edition by Margaret Lial,Stanley Salzman,Diana Hestwood
Edition 9ISBN: 978-0321914514 Exercise 6
The American Farm Bureau Federation reports that the average adult in the UnitedStates will work 40 days (rounded to the nearest day) to earn enough to pay the annualhousehold food bill. This was found by multiplying the average percent of householdincome spent on food by 365 (the number of days in a year). This bar graph shows thepercent of income spent in various countries of the world. Use this graph to answer
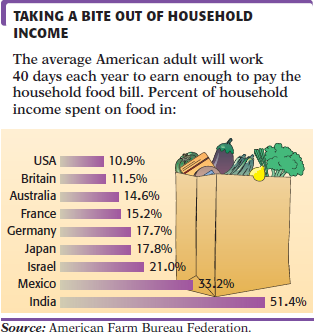 List all countries in the graph in which more than 20% of household income is spent, on average, for food.
List all countries in the graph in which more than 20% of household income is spent, on average, for food.Explanation Verified
Let us draw the bar graph of percent of ...
Basic College Mathematics 9th Edition by Margaret Lial,Stanley Salzman,Diana Hestwood
Why don’t you like this exercise?
Other Minimum 8 character and maximum 255 character
Character 255


