
Economics 12th Edition by William Baumol, Alan S Blinder
Edition 12ISBN: 978-0538453691Economics 12th Edition by William Baumol, Alan S Blinder
Edition 12ISBN: 978-0538453691 Exercise 14
Suppose the supply and demand schedules for bicycles are as they appear in the following table.
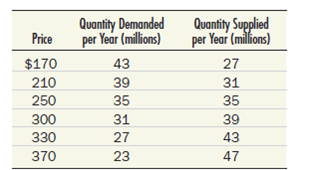
a. Graph these curves and show the equilibrium price and quantity.
b. Now suppose that it becomes unfashionable to ride a bicycle, so that the quantity demanded at each price falls by 8 million bikes per year. What is the new equilibrium price and quantity Show this solution graphically. Explain why the quantity falls by less than 8 million bikes per year.
c. Suppose instead that several major bicycle producers go out of business, thereby reducing the quantity supplied by 8 million bikes at every price. Find the new equilibrium price and quantity, and show it graphically. Explain again why quantity falls by less than 8 million.
d. What are the equilibrium price and quantity if the shifts described in Test Yourself Questions 3(b) and 3(c) happen at the same time
Explanation Verified
(a) The following is graphical represent...
Economics 12th Edition by William Baumol, Alan S Blinder
Why don’t you like this exercise?
Other Minimum 8 character and maximum 255 character
Character 255


