
Economics: A Contemporary Introduction 9th Edition by William McEachern
Edition 9ISBN: 9780538453745Economics: A Contemporary Introduction 9th Edition by William McEachern
Edition 9ISBN: 9780538453745 Exercise 2
Drawing Graphs Sketch a graph to illustrate your idea of each of the following relationships. Be sure to label each axis appropriately. For each relationship, explain under what circumstances, if any, the curve could shift:
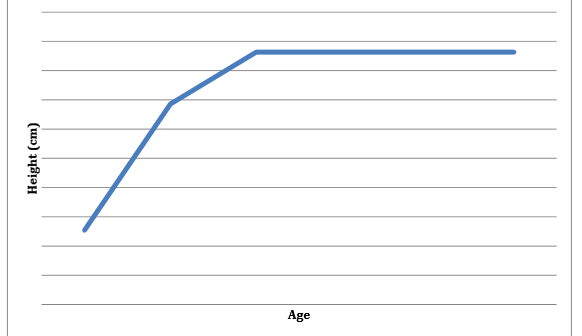
a. The relationship between a person's age and height
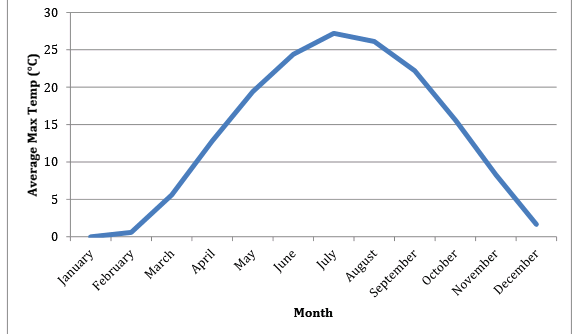
b. Average monthly temperature in your home town over the course of a year
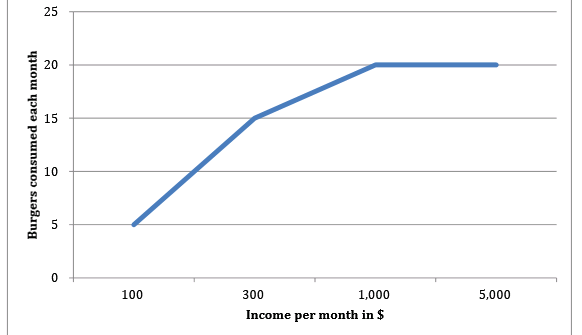
c. A person's income and the number of hamburgers consumed per month
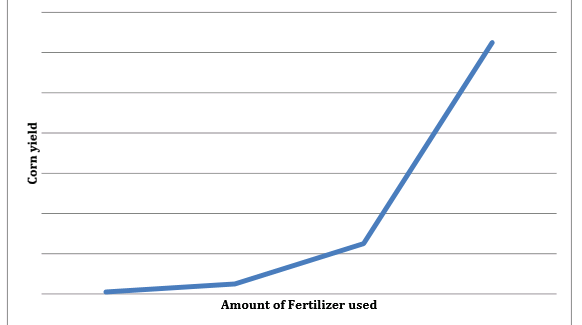
d. The amount of fertilizer added to an acre and the amount of corn grown on that land in one growing season
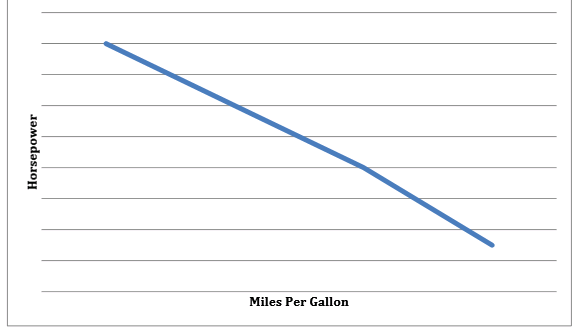
e. An automobile's horsepower and its gasoline mileage (in miles per gallon)
a. The relationship between a person's age and height
b. Average monthly temperature in your home town over the course of a year
c. A person's income and the number of hamburgers consumed per month
d. The amount of fertilizer added to an acre and the amount of corn grown on that land in one growing season
e. An automobile's horsepower and its gasoline mileage (in miles per gallon)
Explanation Verified


Economics: A Contemporary Introduction 9th Edition by William McEachern
Why don’t you like this exercise?
Other Minimum 8 character and maximum 255 character
Character 255


