Electronic Communication Systems 2nd Edition by Roy Blake
Edition 2ISBN: 978-0766826847Electronic Communication Systems 2nd Edition by Roy Blake
Edition 2ISBN: 978-0766826847 Exercise 9
The spectrum analyzer display in Figure 3.21 represents the output of an AM transmitter. The analyzer has an input impedance of 50 and is connected to the transmitter output through a 60 dB attenuator. Sketch the envelope of the signal in the time domain, as it would appear at the transmitter output terminals. Be sure to show both time and voltage scales.
Figure 3.21
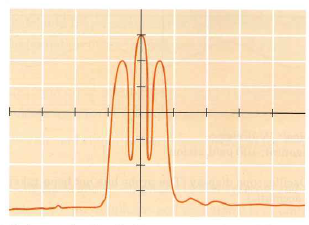
Reference level: -10 dBm
Vertical: 10 dB/division
Center frequency: 21.200 MHz
Span: 5 kHz/division
Figure 3.21
Reference level: -10 dBm
Vertical: 10 dB/division
Center frequency: 21.200 MHz
Span: 5 kHz/division
Explanation Verified
The input impedance of the analyzer is 5...
Electronic Communication Systems 2nd Edition by Roy Blake
Why don’t you like this exercise?
Other Minimum 8 character and maximum 255 character
Character 255


