
Introduction to Econometrics 3rd Edition by James Stock, Mark Watson
Edition 3ISBN: 978-9352863501Introduction to Econometrics 3rd Edition by James Stock, Mark Watson
Edition 3ISBN: 978-9352863501 Exercise 8
Use the data set CPS08 described in Empirical Exercise 1 to answer the following questions.
a. Discuss the internal validity of the regressions that you used to answer Empirical Exercise 2. Include a discussion of possible omitted variable bias, misspecification of the functional form of the regression, errors in variables, sample selection, simultaneous causality, and inconsistency of the OLS standard errors.
b. The data set CPS92_08 described in Empirical Exercise 3 includes data from 2008 and 1992. Use these data to investigate the (temporal) external validity of the conclusions that you reached in Empirical Exercise 1.
Exercise 1
Suppose that a researcher, using data on class size ( CS ) and average test scores from 100 third-grade classes, estimates the OLS regression

a. A classroom has 22 students. What is the regression's prediction for that classroom's average test score
b. Last year a classroom had 19 students, and this year it has 23 students. What is the regression's prediction for the change in the classroom average test score
c. The sample average class size across the 100 classrooms is 21.4. What is the sample average of the test scores across the 100 classrooms
d. What is the sample standard deviation of test scores across the 100 classrooms
Exercise 2
Sales in a company are $196 million in 2009 and increase to $198 million in 2010.
a. Compute the percentage increase in sales using the usual formula
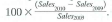 Compare this value to the approximation

b. Repeat (a) assuming Sales 2010 = 205, Sales 2010 = 250, and Sales 2010 = 500.
c. How good is the approximation when the change is small Does the quality of the approximation deteriorate as the percentage change increases
Exercise 3
In a population, Y = 100 and 2 y = 43. Use the central limit theorem to answer the following questions:
a. In a random sample of size n = 100, find Pr(
 101).
101).
b. In a random sample of size n = 64, find Pr(101
 103).
103).
c. In a random sample of size n = 165, find Pr(
 98).
98).
a. Discuss the internal validity of the regressions that you used to answer Empirical Exercise 2. Include a discussion of possible omitted variable bias, misspecification of the functional form of the regression, errors in variables, sample selection, simultaneous causality, and inconsistency of the OLS standard errors.
b. The data set CPS92_08 described in Empirical Exercise 3 includes data from 2008 and 1992. Use these data to investigate the (temporal) external validity of the conclusions that you reached in Empirical Exercise 1.
Exercise 1
Suppose that a researcher, using data on class size ( CS ) and average test scores from 100 third-grade classes, estimates the OLS regression
a. A classroom has 22 students. What is the regression's prediction for that classroom's average test score
b. Last year a classroom had 19 students, and this year it has 23 students. What is the regression's prediction for the change in the classroom average test score
c. The sample average class size across the 100 classrooms is 21.4. What is the sample average of the test scores across the 100 classrooms
d. What is the sample standard deviation of test scores across the 100 classrooms
Exercise 2
Sales in a company are $196 million in 2009 and increase to $198 million in 2010.
a. Compute the percentage increase in sales using the usual formula
Compare this value to the approximation b. Repeat (a) assuming Sales 2010 = 205, Sales 2010 = 250, and Sales 2010 = 500.
c. How good is the approximation when the change is small Does the quality of the approximation deteriorate as the percentage change increases
Exercise 3
In a population, Y = 100 and 2 y = 43. Use the central limit theorem to answer the following questions:
a. In a random sample of size n = 100, find Pr(
101).b. In a random sample of size n = 64, find Pr(101
103).c. In a random sample of size n = 165, find Pr(
98).Explanation Verified
a.
The threats to internal validity of ...
Introduction to Econometrics 3rd Edition by James Stock, Mark Watson
Why don’t you like this exercise?
Other Minimum 8 character and maximum 255 character
Character 255


