
Introduction to Econometrics 3rd Edition by James Stock, Mark Watson
Edition 3ISBN: 978-9352863501Introduction to Econometrics 3rd Edition by James Stock, Mark Watson
Edition 3ISBN: 978-9352863501 Exercise 16
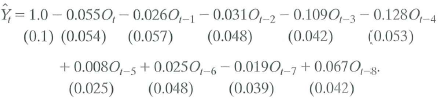
Increases in oil prices have been blamed for several recessions in developed countries. To quantify the effect of oil prices on real economic activity, researchers have done regressions like those discussed in this chapter. Let GDP t denote the value of quarterly gross domestic product in the United States and let Y t =(Q\n(GDP t / GDP t-1 ) be the quarterly percentage change in GDP. James Hamilton, an econometrician and macroeconomist, has suggested that oil prices adversely affect that economy only when they jump above their values in the recent past. Specifically, let O, equal the greater of zero or the percentage point difference between oil prices at date t and their maximum value during the past year. A distributed lag regression relating Y t and O t estimated over 1955:1-2000:IV, is
a. Suppose that oil prices jump 25% above their previous peak value and stay at this new higher level (so that O t = 25 and O t+1 = O t+2 = • • • = 0). What is the predicted effect on output growth for each quarter over the next 2 years
b. Construct a 95% confidence interval for your answers in (a).
c. What is the predicted cumulative change in GDP growth over eight quarters
d. The HAC F-statistic testing whether the coefficients on O t and its lags are zero is 3.49. Are the coefficients significantly different from zero
Explanation Verified
a.
Make a table to predict the effect o...
Introduction to Econometrics 3rd Edition by James Stock, Mark Watson
Why don’t you like this exercise?
Other Minimum 8 character and maximum 255 character
Character 255


