
Introduction to Econometrics 3rd Edition by James Stock, Mark Watson
Edition 3ISBN: 978-9352863501Introduction to Econometrics 3rd Edition by James Stock, Mark Watson
Edition 3ISBN: 978-9352863501 Exercise 1
In this exercise you will estimate the effect of oil prices on macroeconomic activity using monthly data on the Index of Industrial Production (IP) and the monthly measure of O, described in Exercise 15.1. The data can be found on the textbook Web site www.pearsonhighered.com/stock_watson in the file USMacroJVlonthly.
a. Compute the monthly growth rate in IP expressed in percentage points, What are the mean and standard deviation of ip_growth over the 1952:1-2009:12 sample period
b. Plot the value of O t Why are so many values of O t equal to zero Why aren't some values of O t negative
c. Estimate a distributed lag model of ip_growth onto current and 18 lagged values of O r What value of the HAC standard truncation parameter m did you choose Why
d. Taken as a group, are the coefficients on O t statistically significantly different from zero
e. Construct graphs like those in Figure 15.2 showing the estimated dynamic multipliers, cumulative multipliers, and 95% confidence intervals. Comment on the real-world size of the multipliers.
f. Suppose that high demand in the United States (evidenced by large values of ip_growth) leads to increases in oil prices. Is O i exogenous Are the estimated multipliers shown in the graphs in (e) reliable Explain.
Exercise
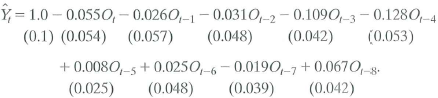
Increases in oil prices have been blamed for several recessions in developed countries. To quantify the effect of oil prices on real economic activity, researchers have done regressions like those discussed in this chapter. Let GDP t denote the value of quarterly gross domestic product in the United States and let Y t =(Q\n(GDP t / GDP t-1 ) be the quarterly percentage change in GDP. James Hamilton, an econometrician and macroeconomist, has suggested that oil prices adversely affect that economy only when they jump above their values in the recent past. Specifically, let O, equal the greater of zero or the percentage point difference between oil prices at date t and their maximum value during the past year. A distributed lag regression relating Y t and O t estimated over 1955:1-2000:IV, is
a. Suppose that oil prices jump 25% above their previous peak value and stay at this new higher level (so that O t = 25 and O t+1 = O t+2 = • • • = 0). What is the predicted effect on output growth for each quarter over the next 2 years
b. Construct a 95% confidence interval for your answers in (a).
c. What is the predicted cumulative change in GDP growth over eight quarters
d. The HAC F-statistic testing whether the coefficients on O t and its lags are zero is 3.49. Are the coefficients significantly different from zero
a. Compute the monthly growth rate in IP expressed in percentage points, What are the mean and standard deviation of ip_growth over the 1952:1-2009:12 sample period
b. Plot the value of O t Why are so many values of O t equal to zero Why aren't some values of O t negative
c. Estimate a distributed lag model of ip_growth onto current and 18 lagged values of O r What value of the HAC standard truncation parameter m did you choose Why
d. Taken as a group, are the coefficients on O t statistically significantly different from zero
e. Construct graphs like those in Figure 15.2 showing the estimated dynamic multipliers, cumulative multipliers, and 95% confidence intervals. Comment on the real-world size of the multipliers.
f. Suppose that high demand in the United States (evidenced by large values of ip_growth) leads to increases in oil prices. Is O i exogenous Are the estimated multipliers shown in the graphs in (e) reliable Explain.
Exercise
Increases in oil prices have been blamed for several recessions in developed countries. To quantify the effect of oil prices on real economic activity, researchers have done regressions like those discussed in this chapter. Let GDP t denote the value of quarterly gross domestic product in the United States and let Y t =(Q\n(GDP t / GDP t-1 ) be the quarterly percentage change in GDP. James Hamilton, an econometrician and macroeconomist, has suggested that oil prices adversely affect that economy only when they jump above their values in the recent past. Specifically, let O, equal the greater of zero or the percentage point difference between oil prices at date t and their maximum value during the past year. A distributed lag regression relating Y t and O t estimated over 1955:1-2000:IV, is
a. Suppose that oil prices jump 25% above their previous peak value and stay at this new higher level (so that O t = 25 and O t+1 = O t+2 = • • • = 0). What is the predicted effect on output growth for each quarter over the next 2 years
b. Construct a 95% confidence interval for your answers in (a).
c. What is the predicted cumulative change in GDP growth over eight quarters
d. The HAC F-statistic testing whether the coefficients on O t and its lags are zero is 3.49. Are the coefficients significantly different from zero
Explanation Verified
Consider the table:
![]() a.
a.
In order to com...
Introduction to Econometrics 3rd Edition by James Stock, Mark Watson
Why don’t you like this exercise?
Other Minimum 8 character and maximum 255 character
Character 255


