
Introduction to Econometrics 3rd Edition by James Stock, Mark Watson
Edition 3ISBN: 978-9352863501Introduction to Econometrics 3rd Edition by James Stock, Mark Watson
Edition 3ISBN: 978-9352863501 Exercise 6
Consider two different randomized experiments. In experiment A, oil prices are set randomly and the central bank reacts according to its usual policy rules in response to economic conditions, including changes in the oil price. In experiment B, oil prices are set randomly and the central bank holds interest rates constant and in particular does not respond to the oil price changes. In both, GDP growth is observed. Now suppose that oil prices are exogenous in the regression in Exercise 15.1.To which experiment, A or B, does the dynamic causal effect estimated in Exercise 15.1 correspond
Exercise
Increases in oil prices have been blamed for several recessions in developed countries. To quantify the effect of oil prices on real economic activity, researchers have done regressions like those discussed in this chapter. Let GDP t denote the value of quarterly gross domestic product in the United States and let Y t =(Q\n(GDP t / GDP t-1 ) be the quarterly percentage change in GDP. James Hamilton, an econometrician and macroeconomist, has suggested that oil prices adversely affect that economy only when they jump above their values in the recent past. Specifically, let O, equal the greater of zero or the percentage point difference between oil prices at date t and their maximum value during the past year. A distributed lag regression relating Y t and O t estimated over 1955:1-2000:IV, is
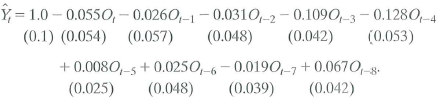
a. Suppose that oil prices jump 25% above their previous peak value and stay at this new higher level (so that O t = 25 and O t+l = O t +2 = • • • = 0). What is the predicted change in interest rates for each quarter over the next 2 years
b. Construct 95% confidence intervals for your answers to (a).
c. What is the effect of this change in oil prices on the level of interest rates in period t + 8 How is your answer related to the cumulative multiplier
d. The HAC F-statistic testing whether the coefficients on O t and its lags are zero is 4.25. Are the coefficients significantly different from zero
Exercise
Increases in oil prices have been blamed for several recessions in developed countries. To quantify the effect of oil prices on real economic activity, researchers have done regressions like those discussed in this chapter. Let GDP t denote the value of quarterly gross domestic product in the United States and let Y t =(Q\n(GDP t / GDP t-1 ) be the quarterly percentage change in GDP. James Hamilton, an econometrician and macroeconomist, has suggested that oil prices adversely affect that economy only when they jump above their values in the recent past. Specifically, let O, equal the greater of zero or the percentage point difference between oil prices at date t and their maximum value during the past year. A distributed lag regression relating Y t and O t estimated over 1955:1-2000:IV, is
a. Suppose that oil prices jump 25% above their previous peak value and stay at this new higher level (so that O t = 25 and O t+l = O t +2 = • • • = 0). What is the predicted change in interest rates for each quarter over the next 2 years
b. Construct 95% confidence intervals for your answers to (a).
c. What is the effect of this change in oil prices on the level of interest rates in period t + 8 How is your answer related to the cumulative multiplier
d. The HAC F-statistic testing whether the coefficients on O t and its lags are zero is 4.25. Are the coefficients significantly different from zero
Explanation Verified
The dynamic casual effects can be estima...
Introduction to Econometrics 3rd Edition by James Stock, Mark Watson
Why don’t you like this exercise?
Other Minimum 8 character and maximum 255 character
Character 255


