
Macroeconomics 12th Edition by Rudiger Dornbusch, Stanley Fischer ,Richard Startz
Edition 12ISBN: 978-1259070969Macroeconomics 12th Edition by Rudiger Dornbusch, Stanley Fischer ,Richard Startz
Edition 12ISBN: 978-1259070969 Exercise 10
Section 6-2 investigates whether the expectations-augmented Phillips curve fits the data better. In doing this it assumes that next period's expected inflation rate is given by the inflation rate observed today
 In this exercise you are asked to investigate whether the fit improves if one uses economic forecaster's measures of inflation expectations.
a. Go to http://research.stlouisfed.org/fred2 and click on "Categories," under "Prices" select "Consumer Price Indexes (CPI and PCE)," then select "Consumer Price Index for All Urban Consumers: All Items." Click on "Download Data" and change the unit to "Percent Change from Year Ago" to obtain inflation rates. You will have to take the averages in EXCEL to get annual rates. Also download annual unemployment rate ( t ) data for the same period on www.bls.gov/cps. Scroll down to "CPS Database" and click on "Top Picks" next to "Labor Force Statistics including the National Unemployment Rate." Then, download "Unemployment Rate-Civilian Labor Force." You will have to take the averages in EXCEL to get annual rates.
b. Now do a search for "University of Michigan Inflation Expectation." (Transform the monthly data into annual by using the option "Last Month of Year".) Copy the annual data into your EXCEL file.
c. Compute the difference between inflation and expected inflation
 In computing the difference be careful about the dating of the variables. The University of Michigan inflation expectation variables gives the expected inflation over the following year. For example, the 1978 observation is equal to 7.3. This means that inflation during 1979 is expected to be equal to 7.3 percent.
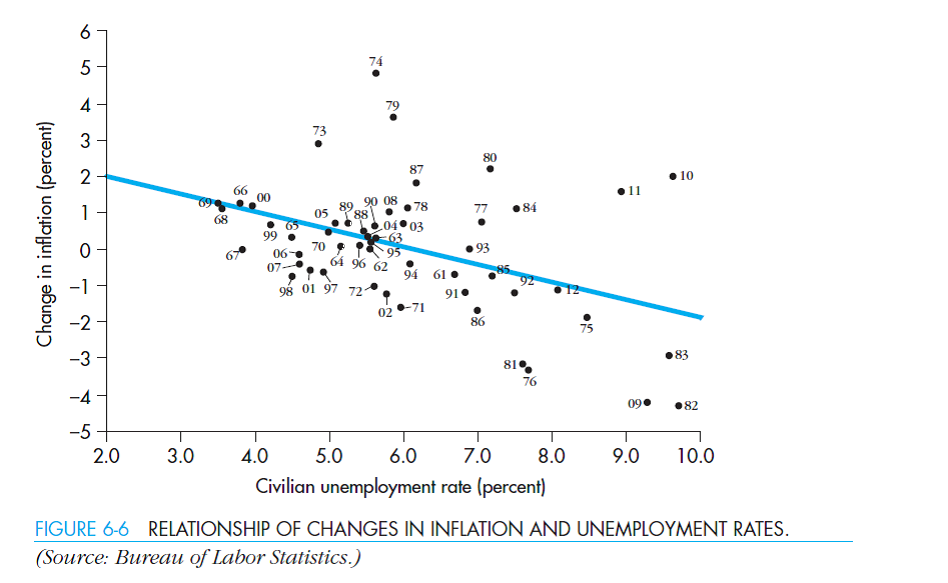
d. Create a scatterplot that has the difference between inflation and expected inflation on the Y axis and the unemployment rate on the X axis. Visually compare the graph you obtained with Figure 6-6 in the chapter. Which one looks more like a Phillips curve *
e. If you have taken a statistics class use EXCEL or a statistical program in order to run the following regression:
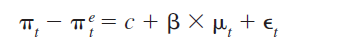
What is the implied slope of the Phillips curve Is it statistically significant Interpret your results.
In this exercise you are asked to investigate whether the fit improves if one uses economic forecaster's measures of inflation expectations. a. Go to http://research.stlouisfed.org/fred2 and click on "Categories," under "Prices" select "Consumer Price Indexes (CPI and PCE)," then select "Consumer Price Index for All Urban Consumers: All Items." Click on "Download Data" and change the unit to "Percent Change from Year Ago" to obtain inflation rates. You will have to take the averages in EXCEL to get annual rates. Also download annual unemployment rate ( t ) data for the same period on www.bls.gov/cps. Scroll down to "CPS Database" and click on "Top Picks" next to "Labor Force Statistics including the National Unemployment Rate." Then, download "Unemployment Rate-Civilian Labor Force." You will have to take the averages in EXCEL to get annual rates.
b. Now do a search for "University of Michigan Inflation Expectation." (Transform the monthly data into annual by using the option "Last Month of Year".) Copy the annual data into your EXCEL file.
c. Compute the difference between inflation and expected inflation
In computing the difference be careful about the dating of the variables. The University of Michigan inflation expectation variables gives the expected inflation over the following year. For example, the 1978 observation is equal to 7.3. This means that inflation during 1979 is expected to be equal to 7.3 percent. d. Create a scatterplot that has the difference between inflation and expected inflation on the Y axis and the unemployment rate on the X axis. Visually compare the graph you obtained with Figure 6-6 in the chapter. Which one looks more like a Phillips curve *
e. If you have taken a statistics class use EXCEL or a statistical program in order to run the following regression:
What is the implied slope of the Phillips curve Is it statistically significant Interpret your results.
Explanation

This question doesn’t have an expert verified answer yet, let Quizplus AI Copilot help.
Macroeconomics 12th Edition by Rudiger Dornbusch, Stanley Fischer ,Richard Startz
Why don’t you like this exercise?
Other Minimum 8 character and maximum 255 character
Character 255


