
Macroeconomics 11th Edition by Michael Parkin
Edition 11ISBN: 9780133423884Macroeconomics 11th Edition by Michael Parkin
Edition 11ISBN: 9780133423884 Exercise 37
Explain how we "read" the three graphs in Fig. l and 2.
FIGURE 1 Making a Graph
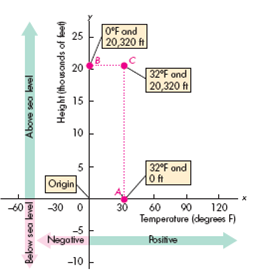
Graphs have axes that measure quantities as distances. Here, the horizontal axis ( x -axis) measures temperature, and the vertical axis ( y -axis) measures height. Point A represents a fishing boat at sea level (0 on the y -axis) on a day when the temperature is 32°F. Point B represents a climber at the top of Mt. McKinley, 20,320 feet above sea level at a temperature of 0°F. Point C represents a climber at the top of Mt. McKinley, 20,320 feet above sea level at a temperature of 32°F.
FIGURE 2 Two Graphs of Economic Data
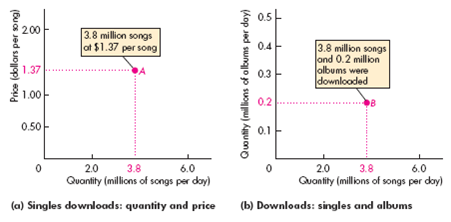
The graph in part (a) tells us that in 2010, 3.8 million songs per day were downloaded at an average price of $1.37 per song.
The graph in part (b) tells us that in 2010, 3.8 million songs per day and 0.2 million albums per day were downloaded.
FIGURE 1 Making a Graph
Graphs have axes that measure quantities as distances. Here, the horizontal axis ( x -axis) measures temperature, and the vertical axis ( y -axis) measures height. Point A represents a fishing boat at sea level (0 on the y -axis) on a day when the temperature is 32°F. Point B represents a climber at the top of Mt. McKinley, 20,320 feet above sea level at a temperature of 0°F. Point C represents a climber at the top of Mt. McKinley, 20,320 feet above sea level at a temperature of 32°F.
FIGURE 2 Two Graphs of Economic Data
The graph in part (a) tells us that in 2010, 3.8 million songs per day were downloaded at an average price of $1.37 per song.
The graph in part (b) tells us that in 2010, 3.8 million songs per day and 0.2 million albums per day were downloaded.
Explanation Verified
Relationship between height and temperat...
Macroeconomics 11th Edition by Michael Parkin
Why don’t you like this exercise?
Other Minimum 8 character and maximum 255 character
Character 255


