
Macroeconomics 11th Edition by Michael Parkin
Edition 11ISBN: 9780133423884Macroeconomics 11th Edition by Michael Parkin
Edition 11ISBN: 9780133423884 Exercise 12
Use the following spreadsheet to work Problem. The spreadsheet provides data on oil and gasoline: Column A is the year, column B is the price of oil (dollars per barrel), column C is the price of gasoline (cents per gallon), column D is U.S. oil production, and column E is the U.S. quantity of gasoline refined (both in millions of barrels per day).
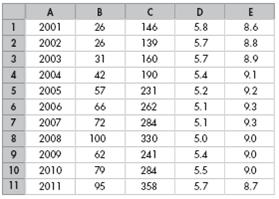
Draw a scatter diagram of the price of gasoline and the quantity of gasoline refined. Describe the relationship.
Draw a scatter diagram of the price of gasoline and the quantity of gasoline refined. Describe the relationship.
Explanation Verified
Table-1 show the price of the oil and th...
Macroeconomics 11th Edition by Michael Parkin
Why don’t you like this exercise?
Other Minimum 8 character and maximum 255 character
Character 255


