Contemporary Mathematics for Business & Consumers 8th Edition by Robert Brechner,Geroge Bergeman
Edition 8ISBN: 978-1305585454Contemporary Mathematics for Business & Consumers 8th Edition by Robert Brechner,Geroge Bergeman
Edition 8ISBN: 978-1305585454 Exercise 25
You are the vice president in charge of production for Endeavor Marine, Inc., a manufacturer of custom fishing boats. The following figures represent the number of boats manufactured during each of the past 18 months.
12 15 24 18 22 16 21 19 10 14 26 23 17 15 21 9 28 13
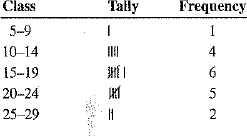
a. Group the data into five classes of equal size (5-9, 10-14, 15-19, 20-24, and 25-29) and construct a frequency distribution of the number of boats.
b. Calculate the mean of the grouped data by using 7, 12, 17, 22, and 27 as the midpoints. Round the mean to the nearest tenth if necessary.

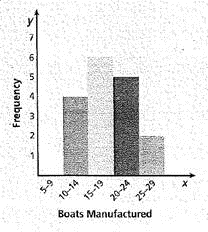
C. Construct a histogram of these data to graphically illustrate your company's boat manufacturing figures.
12 15 24 18 22 16 21 19 10 14 26 23 17 15 21 9 28 13
a. Group the data into five classes of equal size (5-9, 10-14, 15-19, 20-24, and 25-29) and construct a frequency distribution of the number of boats.
b. Calculate the mean of the grouped data by using 7, 12, 17, 22, and 27 as the midpoints. Round the mean to the nearest tenth if necessary.
C. Construct a histogram of these data to graphically illustrate your company's boat manufacturing figures.
Explanation Verified
Contemporary Mathematics for Business & Consumers 8th Edition by Robert Brechner,Geroge Bergeman
Why don’t you like this exercise?
Other Minimum 8 character and maximum 255 character
Character 255


