
A Visual Approach to SPSS for Windows 2nd Edition by Leonard Stern
Edition 2ISBN: 978-0205706051A Visual Approach to SPSS for Windows 2nd Edition by Leonard Stern
Edition 2ISBN: 978-0205706051 Exercise 1
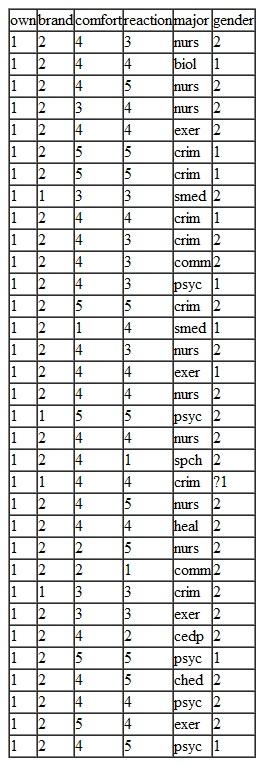
Shown below are data gathered by the author in 1999 from students enrolled in an introductory statistics class. The intent of the survey was to assess the reaction of students to using computer software to perform statistical calculations in the class instead of doing all the calculations by hand using a calculator.
1. Type the data into the SPSS Statistics Data Editor. Note that the data in column 5 are values of a string variable, so make the appropriate declaration of variable type in the Variable View before entering values. Also, name the variables using names shown in the top row of the table.
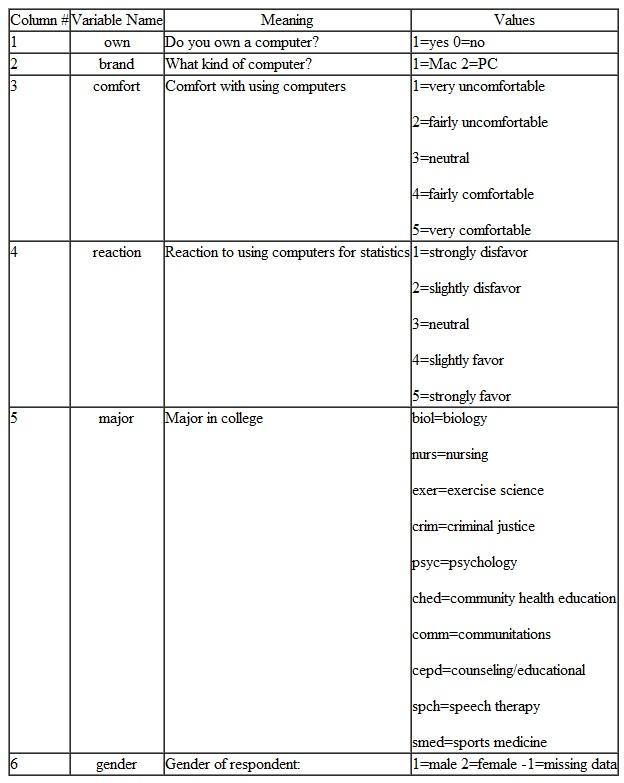
2. Use the information in the column labeled Meaning in the table shown below to make suitable variable labels for the data. Then create value labels using the information in the column labeled Values.
3. Save the data file to your desktop (or some other convenient location) as an SPSS (i.e.,. sav ) file named ComputeSurvey.
1. Type the data into the SPSS Statistics Data Editor. Note that the data in column 5 are values of a string variable, so make the appropriate declaration of variable type in the Variable View before entering values. Also, name the variables using names shown in the top row of the table.
2. Use the information in the column labeled Meaning in the table shown below to make suitable variable labels for the data. Then create value labels using the information in the column labeled Values.
3. Save the data file to your desktop (or some other convenient location) as an SPSS (i.e.,. sav ) file named ComputeSurvey.
Explanation Verified
1.
Step 1. Type the data into the SPSS S...
A Visual Approach to SPSS for Windows 2nd Edition by Leonard Stern
Why don’t you like this exercise?
Other Minimum 8 character and maximum 255 character
Character 255


