
A Visual Approach to SPSS for Windows 2nd Edition by Leonard Stern
Edition 2ISBN: 978-0205706051A Visual Approach to SPSS for Windows 2nd Edition by Leonard Stern
Edition 2ISBN: 978-0205706051 Exercise 1
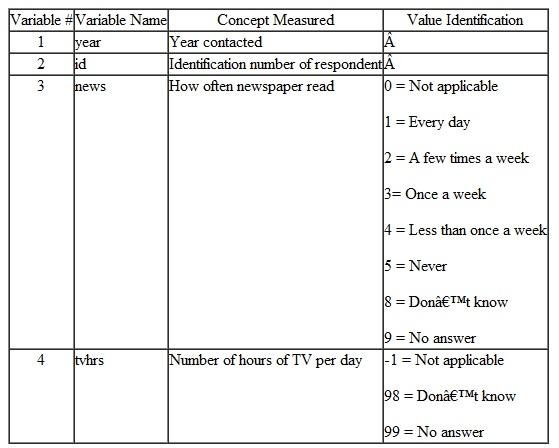
The data in the file GSS92.sav are from randomly selected adults aged 18-65 contacted by the National Opinion Research Center from 1993-1998. The data include two variables used in this chapter's exercises-- news and tvhrs. The variable news is the response to the question "How often do you read the newspaper-every day, a few times a week, once a week, less than once a week, or never " The variable tvhrs is the response to the question "On the average day, how many hours do you personally watch television " The table below describes the variables and their values in the data file.
 1. Recode the variable news into the variable newsfreq whose values have the following meaning:
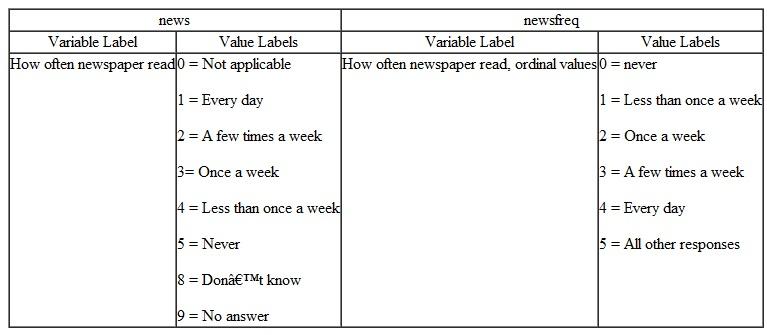
2. Use COMPUTE to create the new variable newsfreq1 whose values are one number higher than those of the variable newsfreq. That is, for newsfreq1 , 1 = never, 2 = less than once a week, 3 = once a week, 4 = a few times a week, 5 = every day, and 6 = all other responses.
1. Recode the variable news into the variable newsfreq whose values have the following meaning: 2. Use COMPUTE to create the new variable newsfreq1 whose values are one number higher than those of the variable newsfreq. That is, for newsfreq1 , 1 = never, 2 = less than once a week, 3 = once a week, 4 = a few times a week, 5 = every day, and 6 = all other responses.
Explanation Verified
1)
Using SPSS, following is the procedur...
A Visual Approach to SPSS for Windows 2nd Edition by Leonard Stern
Why don’t you like this exercise?
Other Minimum 8 character and maximum 255 character
Character 255


