
A Visual Approach to SPSS for Windows 2nd Edition by Leonard Stern
Edition 2ISBN: 978-0205706051A Visual Approach to SPSS for Windows 2nd Edition by Leonard Stern
Edition 2ISBN: 978-0205706051 Exercise 2
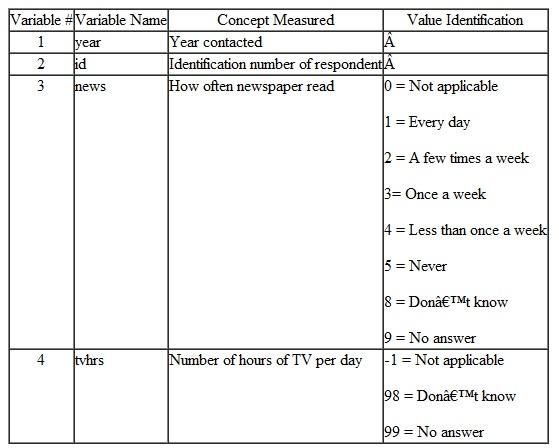
The data in the file GSS92.sav are from randomly selected adults aged 18-65 contacted by the National Opinion Research Center from 1993-1998. The data include two variables used in this chapter's exercises-- news and tvhrs. The variable news is the response to the question "How often do you read the newspaper-every day, a few times a week, once a week, less than once a week, or never " The variable tvhrs is the response to the question "On the average day, how many hours do you personally watch television " The table below describes the variables and their values in the data file.
 Make a new variable, tvhrsfreq , from the variable tvhrs that categorizes the number of hours of TV watched per day into 5 intervals each having about 20% of the cases. For the variable tvhrsfreq use the value 1 to represent the lowest 20% of hours of TV watched per day, the number 2 to represent the next highest 20% of hours of TV watched per day, etc.
Make a new variable, tvhrsfreq , from the variable tvhrs that categorizes the number of hours of TV watched per day into 5 intervals each having about 20% of the cases. For the variable tvhrsfreq use the value 1 to represent the lowest 20% of hours of TV watched per day, the number 2 to represent the next highest 20% of hours of TV watched per day, etc.Explanation Verified
From the given information make a new va...
A Visual Approach to SPSS for Windows 2nd Edition by Leonard Stern
Why don’t you like this exercise?
Other Minimum 8 character and maximum 255 character
Character 255


