
A Visual Approach to SPSS for Windows 2nd Edition by Leonard Stern
Edition 2ISBN: 978-0205706051A Visual Approach to SPSS for Windows 2nd Edition by Leonard Stern
Edition 2ISBN: 978-0205706051 Exercise 3
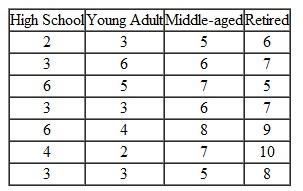
The data shown in the table represent the number of words correctly spelled by different randomly selected members of four age groups.
Number of Words By Age Category
 Use the data to answer these questions:
1. Does age category significantly affect mean number of words spelled correctly In the ANOVA performed to answer the question, request a test of homogeneity of variance, descriptive statistics, and a means plot.
2. After inspecting the data, a researcher decides to determine if high school students are significantly different than each of the other individual age groups on the mean number of words correctly spelled (i.e., high school vs. young adult, high school vs. middle-aged, high school vs. retired). What conclusions should be drawn
Number of Words By Age Category
Use the data to answer these questions:1. Does age category significantly affect mean number of words spelled correctly In the ANOVA performed to answer the question, request a test of homogeneity of variance, descriptive statistics, and a means plot.
2. After inspecting the data, a researcher decides to determine if high school students are significantly different than each of the other individual age groups on the mean number of words correctly spelled (i.e., high school vs. young adult, high school vs. middle-aged, high school vs. retired). What conclusions should be drawn
Explanation Verified
The data on the number of correctly spel...
A Visual Approach to SPSS for Windows 2nd Edition by Leonard Stern
Why don’t you like this exercise?
Other Minimum 8 character and maximum 255 character
Character 255


