
A Visual Approach to SPSS for Windows 2nd Edition by Leonard Stern
Edition 2ISBN: 978-0205706051A Visual Approach to SPSS for Windows 2nd Edition by Leonard Stern
Edition 2ISBN: 978-0205706051 Exercise 2
To determine if a new drug affects feelings of depression, a drug company tests randomly selected depressed males and females who either get the new drug or the standard drug at one of 4 dosage levels (0, 20, 40, or 60 mg). The depression scores (low values = less depressed) for the participants are shown below:
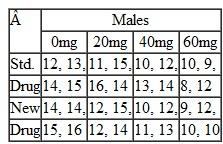
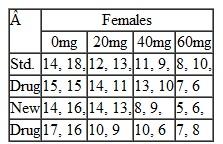 1. Enter the data into SPSS in a manner suitable for conducting a three-way ANOVA that assesses the effects of gender (male, female), drug (standard, new), and dose (0, 20, 40, 60) on the mean depression score.
2. Perform the three-way ANOVA. Include separate line plots for males and females that show dose levels on the x-axis and use separate lines for each drug. Describe the outcome of the analysis.
3. Determine whether there is a linear effect on the marginal means of drug dose. Report the result as an F value and specify the value of partial eta squared.
1. Enter the data into SPSS in a manner suitable for conducting a three-way ANOVA that assesses the effects of gender (male, female), drug (standard, new), and dose (0, 20, 40, 60) on the mean depression score.2. Perform the three-way ANOVA. Include separate line plots for males and females that show dose levels on the x-axis and use separate lines for each drug. Describe the outcome of the analysis.
3. Determine whether there is a linear effect on the marginal means of drug dose. Report the result as an F value and specify the value of partial eta squared.
Explanation Verified
1.
Enter the data into SPSS as shown bel...
A Visual Approach to SPSS for Windows 2nd Edition by Leonard Stern
Why don’t you like this exercise?
Other Minimum 8 character and maximum 255 character
Character 255


