
A Visual Approach to SPSS for Windows 2nd Edition by Leonard Stern
Edition 2ISBN: 978-0205706051A Visual Approach to SPSS for Windows 2nd Edition by Leonard Stern
Edition 2ISBN: 978-0205706051 Exercise 3
Table 15.3 illustrated the means that are compared by various contrasts that are available in the Univariate procedure of the General Linear Model for marginal means of a factor having three levels. Using arrows show the means that are compared for each contrast in the table below of the factor that has four levels.
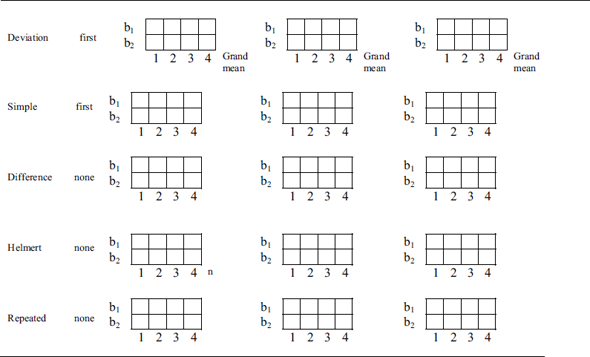
Table 15.3 Illustrations of the means that would be compared by various contrasts available in the Univariate procedure of the General Linear Model. The contrasts are pictured as being applied to the marginal means of factor A with three levels that are referred to as a 1 , a 2 , and a 3.
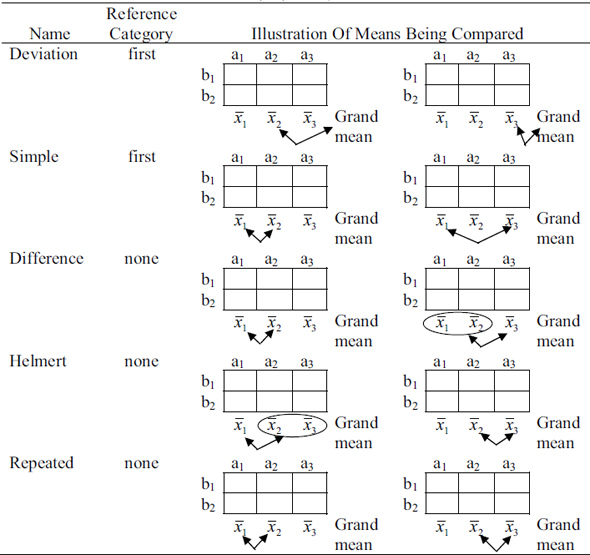
Table 15.3 Illustrations of the means that would be compared by various contrasts available in the Univariate procedure of the General Linear Model. The contrasts are pictured as being applied to the marginal means of factor A with three levels that are referred to as a 1 , a 2 , and a 3.
Explanation Verified
For the comparison labelled Deviation , ...
A Visual Approach to SPSS for Windows 2nd Edition by Leonard Stern
Why don’t you like this exercise?
Other Minimum 8 character and maximum 255 character
Character 255


