
A Visual Approach to SPSS for Windows 2nd Edition by Leonard Stern
Edition 2ISBN: 978-0205706051A Visual Approach to SPSS for Windows 2nd Edition by Leonard Stern
Edition 2ISBN: 978-0205706051 Exercise 2
Plot the factor scores saved in Exercise 1. Label the data points in the scatterplot using the variable Country. Locate the USA in the scatterplot. In terms of the factors you labeled in Exercise 1, where does it fit in on these dimensions
Exercise 1
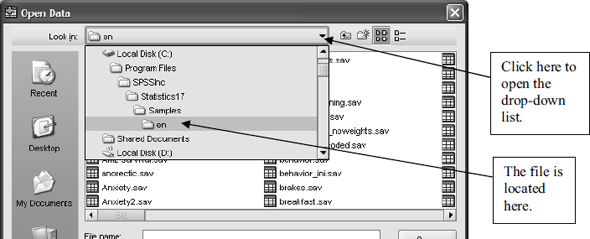
The data file World95.sav is located in the SPSS subdirectory of C:\Program Files. It can be opened from the File menu in SPSS by requesting Open then Data and, if the proper location is not produced by default, locating it using the drop-down menu available from the Look in : window, as shown below:
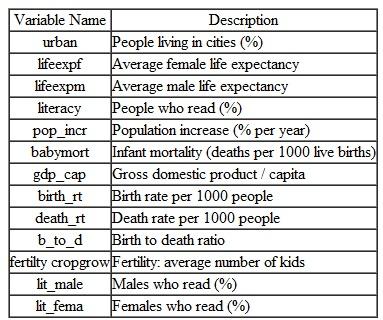
Factor analyze the variables shown in the table below. In performing the analysis
1. Show a table of descriptive statistics for each variable, a correlation matrix, and the KMO statistic.
2. Use a principal components method of factor extraction.
3. Request a scree plot.
4. Use a VARIMAX method of factor rotation.
5. Request loading plots.
6. Save factor scores as variables.
 On the basis of your output for the analysis, answer the following questions.
1. How many countries were included in the analysis
2. What does the magnitude of the KMO statistic indicate about the data
3. What two variables had the lowest communality values
4. How many factors were retained in the analysis
5. What were the eigenvalues of each retained factor
6. What proportion of the total variance of the variables in the analysis was accounted for by the combined retained factors
7. What three variables loaded highest on each of the rotated factors
8. How would you label (i.e., interpret) each of the rotated factors
Exercise 1
The data file World95.sav is located in the SPSS subdirectory of C:\Program Files. It can be opened from the File menu in SPSS by requesting Open then Data and, if the proper location is not produced by default, locating it using the drop-down menu available from the Look in : window, as shown below:
Factor analyze the variables shown in the table below. In performing the analysis
1. Show a table of descriptive statistics for each variable, a correlation matrix, and the KMO statistic.
2. Use a principal components method of factor extraction.
3. Request a scree plot.
4. Use a VARIMAX method of factor rotation.
5. Request loading plots.
6. Save factor scores as variables.
On the basis of your output for the analysis, answer the following questions.1. How many countries were included in the analysis
2. What does the magnitude of the KMO statistic indicate about the data
3. What two variables had the lowest communality values
4. How many factors were retained in the analysis
5. What were the eigenvalues of each retained factor
6. What proportion of the total variance of the variables in the analysis was accounted for by the combined retained factors
7. What three variables loaded highest on each of the rotated factors
8. How would you label (i.e., interpret) each of the rotated factors
Explanation Verified
Here we have two factor scores FACT1_1, ...
A Visual Approach to SPSS for Windows 2nd Edition by Leonard Stern
Why don’t you like this exercise?
Other Minimum 8 character and maximum 255 character
Character 255


