
A Visual Approach to SPSS for Windows 2nd Edition by Leonard Stern
Edition 2ISBN: 978-0205706051A Visual Approach to SPSS for Windows 2nd Edition by Leonard Stern
Edition 2ISBN: 978-0205706051 Exercise 2
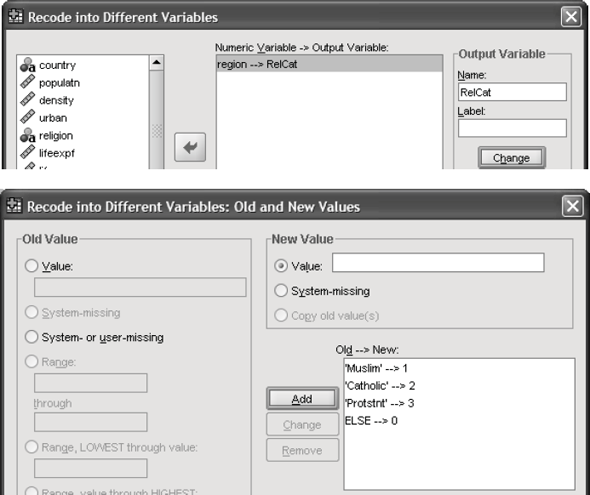
The file World95.sav is located in the SPSS subdirectory of C:\Program Files. It contains a string variable religion. Use Recode into Different Variables to make a new numeric variable RelCat consisting of the values 0 through 3 that have the correspondence shown below in the second window.
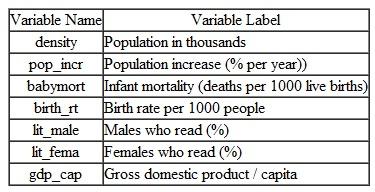
Perform a discriminant analysis to determine the dimensions that best allow religions 1-3 to be distinguished. The table below shows the variable names together with their labels that should be included as predictors in the analysis:
 Answer the following questions:
1. Based on the group centroids, which religions are best distinguished by each function
2. Based on the structure coefficients, what labels might be suitable for describing each dimension
Perform a discriminant analysis to determine the dimensions that best allow religions 1-3 to be distinguished. The table below shows the variable names together with their labels that should be included as predictors in the analysis:
Answer the following questions:1. Based on the group centroids, which religions are best distinguished by each function
2. Based on the structure coefficients, what labels might be suitable for describing each dimension
Explanation Verified
Here we have a string variable religion....
A Visual Approach to SPSS for Windows 2nd Edition by Leonard Stern
Why don’t you like this exercise?
Other Minimum 8 character and maximum 255 character
Character 255


