Managerial Economics & Business Strategy 8th Edition by Michael Baye,Jeff Prince
Edition 8ISBN: 978-1259129858Managerial Economics & Business Strategy 8th Edition by Michael Baye,Jeff Prince
Edition 8ISBN: 978-1259129858 Exercise 12
A large Coca-Cola vendor recently hired some economic analysts to assess the effect of a price increase in its 16-ounce bottles from $1.00 to $2.00. The analysts determined that, on average, the vendor's customers spend about $15.00 on soda (Coke and all other brands) each week, and the average price for other 16-ounce soda bottles is $1.00. The analysts also utilized some focus groups to determine the preferences of the vendor's customers. They used this analysis to build the following graph:
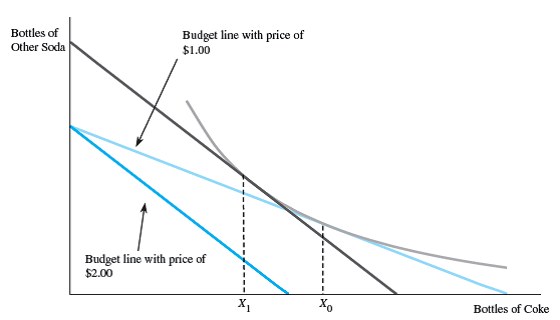
Suppose X 0 = 9 and X 1 = 7. Should the vendor expect to sell 7, more than 7, or less than 7 bottles of Coke after raising the price to $2.00 if Coke is a normal good?
Suppose X 0 = 9 and X 1 = 7. Should the vendor expect to sell 7, more than 7, or less than 7 bottles of Coke after raising the price to $2.00 if Coke is a normal good?
Explanation Verified
There is always negative relation betwee...
Managerial Economics & Business Strategy 8th Edition by Michael Baye,Jeff Prince
Why don’t you like this exercise?
Other Minimum 8 character and maximum 255 character
Character 255


