
Ecology 7th Edition by Manuel Molles
Edition 7ISBN: 978-0077837280Ecology 7th Edition by Manuel Molles
Edition 7ISBN: 978-0077837280 Exercise 17
In chapter 2 (p. 18) we determined the sample mean. However, while the sample mean is one of the most common and useful of summary statistics, it is not the most appropriate statistic for some situations. One of the assumptions underlying the use of the sample mean is that the observations used to calculate it are drawn from a population with a normal, or bell-shaped, distribution. However, where the distribution of values within a population deviates substantially from a normal distribution, it may be better to use another estimator of the population "average." An alternative statistic is the sample median. The sample median is the middle value in a sample. Let's determine the median for the sample we used to determine a sample mean in chapter 2. Here is the table summarizing that sample:
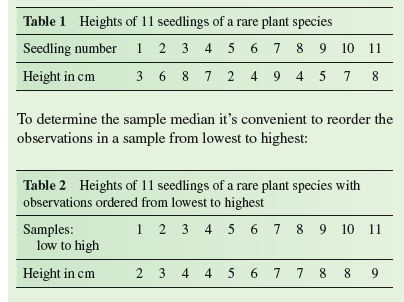
Because there was an odd number of observations in this sample, 11, there is a middle value in the series of observations, with 5 observations with higher value and 5 with lower value. That middle value occurs at sample rank number 6 and the height of the seedling with this rank happens to be 6 cm. So, the sample median is 6 cm. Notice that this value is very similar to the sample mean we calculated in chapter 2, which was 5.7 cm. In this case, the sample mean and sample median give similar estimates of the average within the population.
However, where a population contains a few very large or very small values, the sample median may give a better estimate of the average within the population. Consider the following sample of the abundance of mayfly nymphs living within 0.1 m 2 areas of stream bottom. The sample was taken from a high mountain stream of the southern Rocky Mountains and the mayfly species was Baetis bicaudatus:
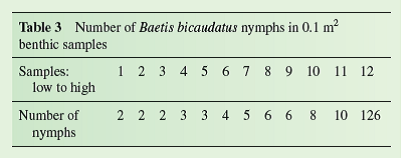
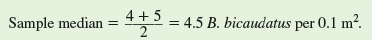
In this case, because one of the samples contained 126 nymphs, the sample median and sample mean give very different estimates of the average number of B. bicaudatus living within a 0.1 m 2 area of the study stream. Because this sample has an even number of observations the sample median is determined as the average of the two middle observations. That is:
The sample mean is
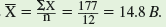 bicaudatus per 0.1 m 2. This estimate of the population mean is more than three times the estimate provided by the sample median. In this case it is clear that the sample median, which again is the middle value in an ordered sample of observations, more closely estimates the number of B. bicaudatus that you are likely to encounter within 0.1 m 2 of benthic habitat in this mountain stream.
Why are comparisons of per capita income in different countries generally reported as differences in median income, rather than mean income
Because there was an odd number of observations in this sample, 11, there is a middle value in the series of observations, with 5 observations with higher value and 5 with lower value. That middle value occurs at sample rank number 6 and the height of the seedling with this rank happens to be 6 cm. So, the sample median is 6 cm. Notice that this value is very similar to the sample mean we calculated in chapter 2, which was 5.7 cm. In this case, the sample mean and sample median give similar estimates of the average within the population.
However, where a population contains a few very large or very small values, the sample median may give a better estimate of the average within the population. Consider the following sample of the abundance of mayfly nymphs living within 0.1 m 2 areas of stream bottom. The sample was taken from a high mountain stream of the southern Rocky Mountains and the mayfly species was Baetis bicaudatus:
In this case, because one of the samples contained 126 nymphs, the sample median and sample mean give very different estimates of the average number of B. bicaudatus living within a 0.1 m 2 area of the study stream. Because this sample has an even number of observations the sample median is determined as the average of the two middle observations. That is:
The sample mean is
bicaudatus per 0.1 m 2. This estimate of the population mean is more than three times the estimate provided by the sample median. In this case it is clear that the sample median, which again is the middle value in an ordered sample of observations, more closely estimates the number of B. bicaudatus that you are likely to encounter within 0.1 m 2 of benthic habitat in this mountain stream. Why are comparisons of per capita income in different countries generally reported as differences in median income, rather than mean income
Explanation Verified
The per capita income of a country is th...
Ecology 7th Edition by Manuel Molles
Why don’t you like this exercise?
Other Minimum 8 character and maximum 255 character
Character 255


