
Ecology 7th Edition by Manuel Molles
Edition 7ISBN: 978-0077837280Ecology 7th Edition by Manuel Molles
Edition 7ISBN: 978-0077837280 Exercise 21
In chapter 2 we calculated the sample mean and in chapter 3 we determined the sample median. The mean and median are different ways of representing the middle, or typical, within a sample of a population. Another important question we can ask is, how much variation is there around the average This is important for several reasons. For example, two or more samples may have the same mean but have quite different amounts of variation among the observations within each sample. Knowing the variation within samples, as well as their means or medians, is critical to comparing them statistically (see "Investigating the Evidence" 17 and 18).
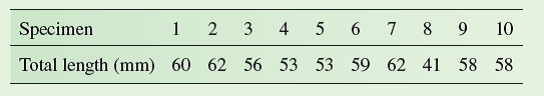
Suppose you are studying a population of whitefish living in Lake Lucerne, Switzerland (see fig. 4.5 , p. 82) and, as part of the study, you need to estimate the variation in length of a small sample of young whitefish taken from the lake. Here are your measurements:

The simplest index of variation would be the range , which is the difference between the largest and the smallest observation. In this case the range would be:
Range = 62 - 41 = 21 mm
The range does not represent variation in samples well, since very different sets of observations can have the same range. A better representation of the variation in a sample is one that factors in all the observations relative to the sample mean. One such index that is most commonly used is called the sample variance. The variance is calculated as follows:
First we calculate the sample mean as we did in chapter 2.
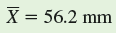 (For practice you could calculate this sample mean using the data given above.)
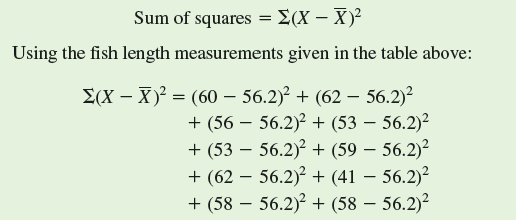
The variance is calculated by squaring the differences between the sample mean and each of the observations, adding them up to produce the "sum of squares," and dividing by the sample size minus 1. Let's do this in steps. First let's calculate the sum of squares.
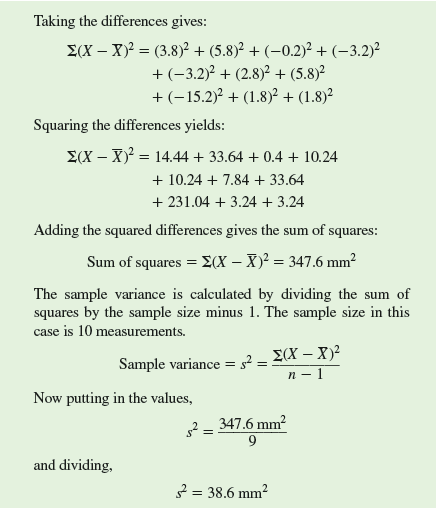
This, then, is the sample variance. However, notice that the units of the sample variance are square mm, not mm. Because the sample variance is expressed in squares of the original units, generally we take the square root of the variance to calculate a measure of variation called the sample standard deviation.
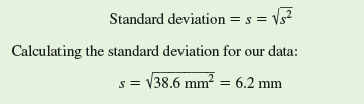
While it took a little effort to calculate it, the standard deviation, 6.2 mm, provides us with a standardized index of the variation in length of the fish used in your study. Fortunately, most electronic calculators make these calculations automatically, once the data are entered. The sample standard deviation along with the sample mean enable us to make statistical comparisons of samples.
Why do the standard deviation and variance generally represent variation in a sample better than the range
Suppose you are studying a population of whitefish living in Lake Lucerne, Switzerland (see fig. 4.5 , p. 82) and, as part of the study, you need to estimate the variation in length of a small sample of young whitefish taken from the lake. Here are your measurements:
The simplest index of variation would be the range , which is the difference between the largest and the smallest observation. In this case the range would be:
Range = 62 - 41 = 21 mm
The range does not represent variation in samples well, since very different sets of observations can have the same range. A better representation of the variation in a sample is one that factors in all the observations relative to the sample mean. One such index that is most commonly used is called the sample variance. The variance is calculated as follows:
First we calculate the sample mean as we did in chapter 2.
(For practice you could calculate this sample mean using the data given above.) The variance is calculated by squaring the differences between the sample mean and each of the observations, adding them up to produce the "sum of squares," and dividing by the sample size minus 1. Let's do this in steps. First let's calculate the sum of squares.
This, then, is the sample variance. However, notice that the units of the sample variance are square mm, not mm. Because the sample variance is expressed in squares of the original units, generally we take the square root of the variance to calculate a measure of variation called the sample standard deviation.
While it took a little effort to calculate it, the standard deviation, 6.2 mm, provides us with a standardized index of the variation in length of the fish used in your study. Fortunately, most electronic calculators make these calculations automatically, once the data are entered. The sample standard deviation along with the sample mean enable us to make statistical comparisons of samples.
Why do the standard deviation and variance generally represent variation in a sample better than the range
Explanation Verified
Range is the most appropriate measure of...
Ecology 7th Edition by Manuel Molles
Why don’t you like this exercise?
Other Minimum 8 character and maximum 255 character
Character 255


