
Ecology 7th Edition by Manuel Molles
Edition 7ISBN: 978-0077837280Ecology 7th Edition by Manuel Molles
Edition 7ISBN: 978-0077837280 Exercise 13
As we have seen, the extent to which phenotypic variation in a trait is determined by genetic variation affects its potential to evolve by natural selection. In other words, the potential for a trait to evolve is affected by the trait's heritability. How can we estimate the heritability of a particular trait One common method is through regression analysis. Regression analysis is a statistical technique used to explore the extent to which one factor, called the independent variable (usually symbolized as X), determines the value of another variable, which we call the dependent variable (usually represented by the symbol Y). In regression analysis, we construct X-Y plots as we did when we explored scatter plots and correlation (Investigating the Evidence, chapter 7, p. 168). However, regression analysis is used to determine the equation for a line, called a regression line , that best fits the relationship between X and Y. When the relationship between X and Y follows a straight line, such as those shown in figure 8.21 , the regression equation takes the following form:
Y = bX + a
In this equation, a is the point at which the line crosses the Y axis, which is called the Y intercept, and b, which is the slope of the line, is the regression coefficient.
Let's use a natural system to learn more about regression analysis and its use in heritability studies. In heritability studies, we are interested in the extent to which the characteristics of parents determine the characteristics of offspring. For instance, a team of Dutch scientists studying waterlily leaf beetles (Pappers et al. 2002) explored the heritability of body size, measured as body length, in different populations of the beetle. As we saw in the studies of Randy Thornhill, male body size can have a very significant influence on mating success (see fig. 8.13 ). To determine the heritability of body length, they conducted regression analyses using the body length of parents as the independent variable, and body length of the offspring as the dependent variable. Because each of the parents contributes to the genotype of the offspring, the value used for parental body length is the "mid-parent body length," which is the average of the two parents' body lengths. Let's consider the relationships between length of parents and offspring, and use regression analysis to estimate heritability of body length in some hypothetical populations of waterlily leaf beetles.
Consider the three scatter plots shown in figure 1 and the lines drawn through the scatter of points. Again, these are much like the scatter plots we examined in chapter 7 but with regression lines drawn through each. The regression coefficient in each of the graphs indicates the level of heritability in the three hypothetical populations. In population (a), the regression coefficient of 0.00 indicates that there is no relationship between parental body length and the body length of offspring. This result is apparent from just the scatter plot, which shows that parents of any length, large or small, can

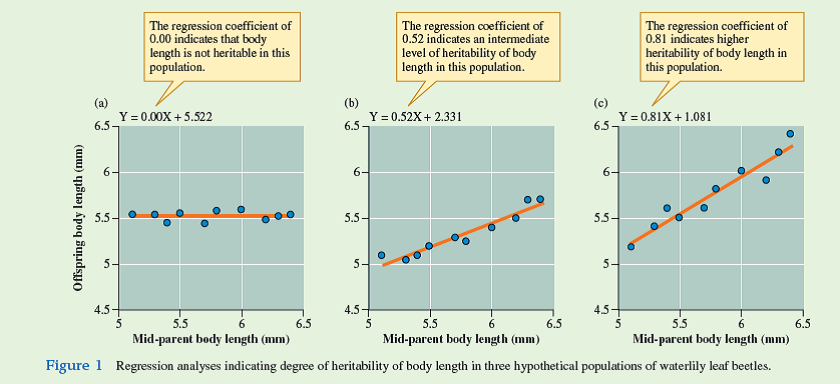
have small or large offspring. In this population it appears that the variation in body length among the offspring is determined entirely by environmental effects. In contrast, body length has a heritability of 0.52 in population (b) and 0.81 in population (c). What do these values indicate With a heritability of 0.52, we can conclude that about half of the variation in body length in population (b) results from genetic effects, and about half from environmental effects, such as food quality, temperature, and so forth. The regression coefficient of 0.81 in population (c) indicates that more of the variation in body length in the offspring in that population is the result of genetic effects.
What are the evolutionary implications of the patterns shown in figure 1
Y = bX + a
In this equation, a is the point at which the line crosses the Y axis, which is called the Y intercept, and b, which is the slope of the line, is the regression coefficient.
Let's use a natural system to learn more about regression analysis and its use in heritability studies. In heritability studies, we are interested in the extent to which the characteristics of parents determine the characteristics of offspring. For instance, a team of Dutch scientists studying waterlily leaf beetles (Pappers et al. 2002) explored the heritability of body size, measured as body length, in different populations of the beetle. As we saw in the studies of Randy Thornhill, male body size can have a very significant influence on mating success (see fig. 8.13 ). To determine the heritability of body length, they conducted regression analyses using the body length of parents as the independent variable, and body length of the offspring as the dependent variable. Because each of the parents contributes to the genotype of the offspring, the value used for parental body length is the "mid-parent body length," which is the average of the two parents' body lengths. Let's consider the relationships between length of parents and offspring, and use regression analysis to estimate heritability of body length in some hypothetical populations of waterlily leaf beetles.
Consider the three scatter plots shown in figure 1 and the lines drawn through the scatter of points. Again, these are much like the scatter plots we examined in chapter 7 but with regression lines drawn through each. The regression coefficient in each of the graphs indicates the level of heritability in the three hypothetical populations. In population (a), the regression coefficient of 0.00 indicates that there is no relationship between parental body length and the body length of offspring. This result is apparent from just the scatter plot, which shows that parents of any length, large or small, can
have small or large offspring. In this population it appears that the variation in body length among the offspring is determined entirely by environmental effects. In contrast, body length has a heritability of 0.52 in population (b) and 0.81 in population (c). What do these values indicate With a heritability of 0.52, we can conclude that about half of the variation in body length in population (b) results from genetic effects, and about half from environmental effects, such as food quality, temperature, and so forth. The regression coefficient of 0.81 in population (c) indicates that more of the variation in body length in the offspring in that population is the result of genetic effects.
What are the evolutionary implications of the patterns shown in figure 1
Explanation Verified
The regression analysis of the degree of...
Ecology 7th Edition by Manuel Molles
Why don’t you like this exercise?
Other Minimum 8 character and maximum 255 character
Character 255


