
Ecology 7th Edition by Manuel Molles
Edition 7ISBN: 978-0077837280Ecology 7th Edition by Manuel Molles
Edition 7ISBN: 978-0077837280 Exercise 3
Imagine sampling a population of plants or animals to determine the distribution of individuals across the habitat. One of the most basic questions that you could ask is, "How are individuals in the population distributed across the study area " How might they be distributed The three basic patterns that we've discussed in this section are clumped, random, and regular distributions. The first step toward testing statistically between these three types of distributions is to sample the population to estimate the mean (p. 18) and variance (pp. 88-89) in density of the population across the study area. The theoretical relationships between variance in density and mean density in clumped, random, and regular distributions are as follows:

How do we connect these relationships between variance and mean density with what we see on the ground In a clumped distribution, many sample plots will contain few or no individuals while some will contain a large number. As a consequence, the variance among sample plots will be high and the variance in density will be greater than the mean. In contrast, sample plots of a population with a regular distribution will all include a similar number of individuals. As a result, the variance in density across samples will be low when taken from a population with a regular distribution; therefore, the variance will be less than the mean. Meanwhile, in a randomly distributed population, the variance in density across the habitat will be approximately equal to the mean density.
Consider the following samples of three different populations of herbaceous plants growing on a desert landscape. Each sample is the number counted in a randomly located 1 m 2 area at the study site.
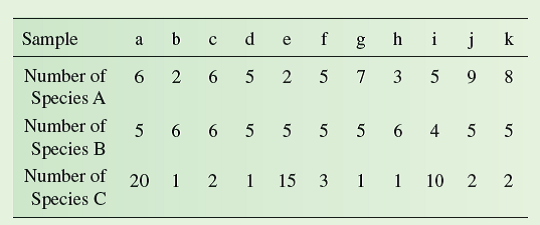
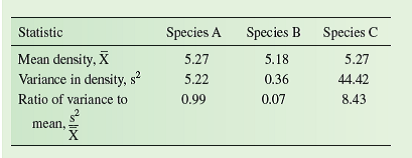
The distribution of individuals among the samples of species A, B, and C is quite different. For instance, each of the samples contained approximately the same number of individuals of species B. In contrast, the numbers of species C varied widely among samples. Meanwhile, counts of species A showed a level of variation somewhere in between variations in species B and C. The samples of species A, B, and C may give the impression of random, regular, and clumped distributions. We can quantify our visual impressions by calculating the sample means and sample variances for the densities of species A, B, and C:
A has a random distribution, that species B has a regular distribution, and that C has a clumped distribution While it is likely that they do, in science we need to attach probabilities to such conclusions. To do that, we need to consider these samples of species A, B, and C from a statistical perspective. We will look at the statistics of these samples in chapter 10 (see p. 236).
According to the results of Phillips and MacMahon, what is the approximate value of the ratio of variance in shrub density to mean shrub density (variance/mean) for young, medium-age, and older creosote bushes (see fig. 9.13 )

How do we connect these relationships between variance and mean density with what we see on the ground In a clumped distribution, many sample plots will contain few or no individuals while some will contain a large number. As a consequence, the variance among sample plots will be high and the variance in density will be greater than the mean. In contrast, sample plots of a population with a regular distribution will all include a similar number of individuals. As a result, the variance in density across samples will be low when taken from a population with a regular distribution; therefore, the variance will be less than the mean. Meanwhile, in a randomly distributed population, the variance in density across the habitat will be approximately equal to the mean density.
Consider the following samples of three different populations of herbaceous plants growing on a desert landscape. Each sample is the number counted in a randomly located 1 m 2 area at the study site.
The distribution of individuals among the samples of species A, B, and C is quite different. For instance, each of the samples contained approximately the same number of individuals of species B. In contrast, the numbers of species C varied widely among samples. Meanwhile, counts of species A showed a level of variation somewhere in between variations in species B and C. The samples of species A, B, and C may give the impression of random, regular, and clumped distributions. We can quantify our visual impressions by calculating the sample means and sample variances for the densities of species A, B, and C:
A has a random distribution, that species B has a regular distribution, and that C has a clumped distribution While it is likely that they do, in science we need to attach probabilities to such conclusions. To do that, we need to consider these samples of species A, B, and C from a statistical perspective. We will look at the statistics of these samples in chapter 10 (see p. 236).
According to the results of Phillips and MacMahon, what is the approximate value of the ratio of variance in shrub density to mean shrub density (variance/mean) for young, medium-age, and older creosote bushes (see fig. 9.13 )
Explanation Verified
The distribution of species in a populat...
Ecology 7th Edition by Manuel Molles
Why don’t you like this exercise?
Other Minimum 8 character and maximum 255 character
Character 255


